

Costco stock weekly forecast: Consolidation risk rises as momentum readings remain extended

Shares of Costco Wholesale Corporation (COST) are trading near $989 as the recovery continues to hold but faces a stretched technical setup. After a mostly quiet week for the stock, attention now turns to whether price momentum can persist in the face of overbought signals heading into next week.
 1021.17
Highlights
- Shares of Costco closed at $989.26, posting a narrow gain of $0.16 over the last week.
- The stock maintains strength above key moving averages, and technical indicators currently register overbought conditions.
- The expected trading range for the coming week is $975.82 to $1,021, with resistance at $1,007 and support at $977.27.
Dividend announcement and accelerating sales drive mixed institutional flows
Costco declared a quarterly cash dividend of $1.47 per share, payable November 13, 2026, to shareholders of record as of October 30, 2026, according to Yahoo Finance. September net sales climbed to $30.02 billion from $26.58 billion a year earlier, as reported by Simply Wall St News, while comparable sales growth accelerated to 7.6% over the previous month, according to Yahoo Finance. Institutional activity was mixed, with some investors increasing and others reducing their positions in COST during the third quarter.
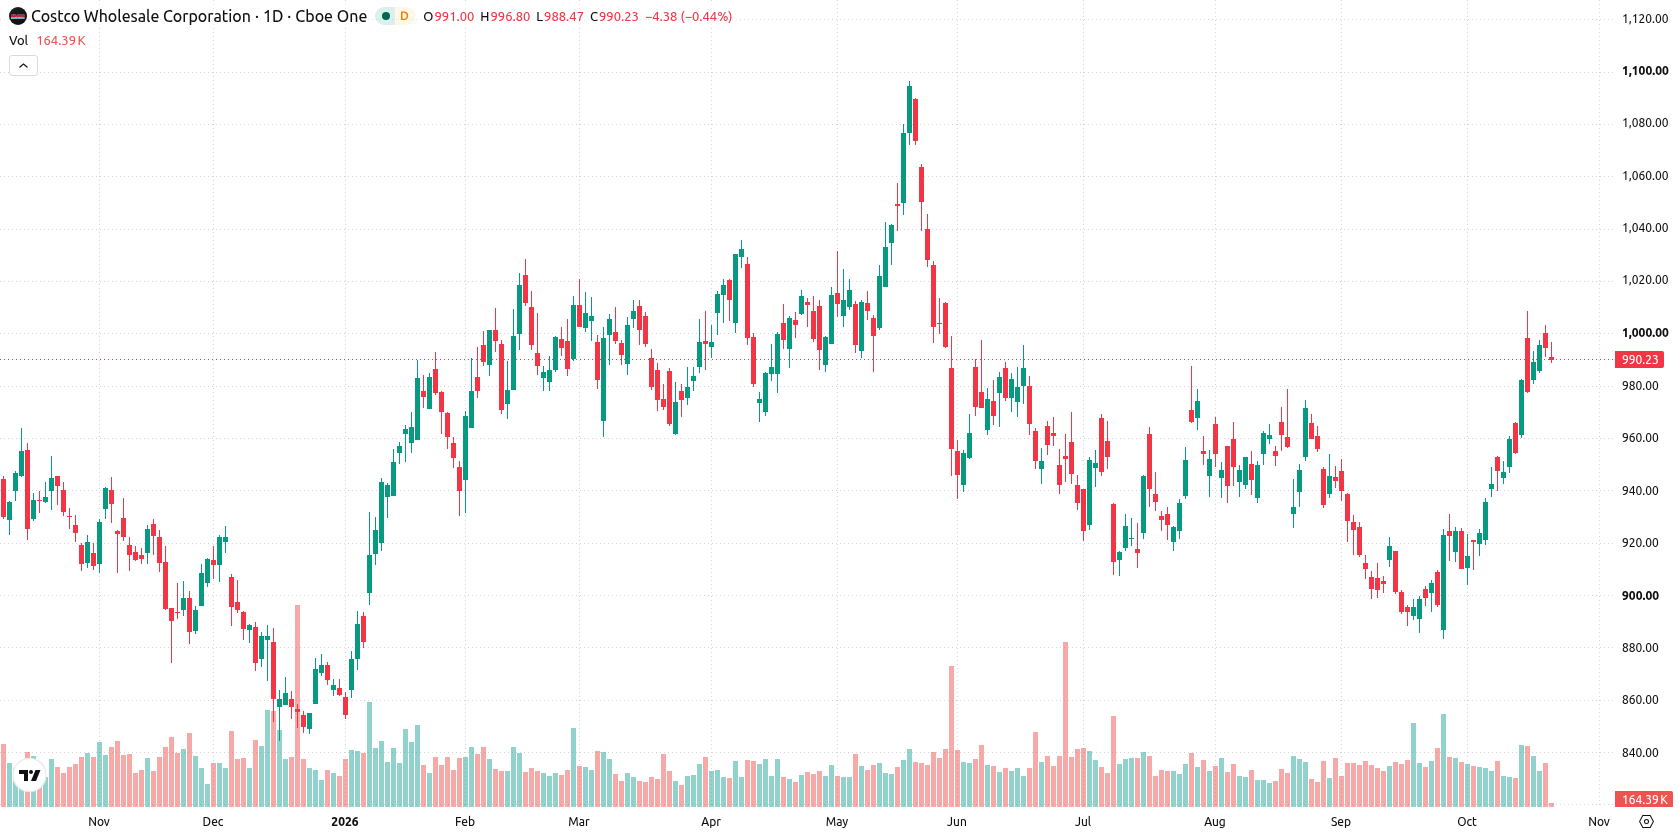
Overbought readings intensify as weekly rally approaches resistance zone
The daily chart shows a sustained move higher with a firm trend, supported by a 3.07% volatility reading for the week. Momentum readings are extended, with RSI at 72.7 and CCI at 134.76, both in the overbought zone, while Bull/Bear Power also signals overbought conditions. Immediate support is seen at $977.27 and resistance at $1,007, with the Ichimoku Kijun at $946.46 offering additional support. This setup suggests the recent advance may be due for some consolidation unless buyers extend momentum further above resistance.
Bullish bias persists with breakout risk above weekly resistance
For the coming trading week, the expected range is $975.82 to $1,021, with a 78% probability of an increase and a 22% probability of a decrease. The base case is continued action between support at $977.27 and resistance at $1,007. A push above $1,007 would favor a bullish scenario toward the $1,021 level. Conversely, a break below $977.27 would expose the lower bound of the expected range.
Earlier, analysts noted that Costco’s robust business performance was accompanied by signals of a stretched technical setup, with support levels highlighted as crucial for sustaining the rally. The current analysis builds on this by identifying $977.27 as a pivotal support to monitor, with any decisive move below it likely to trigger further downside toward the lower end of the trading range.










-
 Afghanistan
-
 Albania
-
 Algeria
-
 Angola
-
 Argentina
-
 Armenia
-
 Australia
-
 Austria
-
 Azerbaijan
-
 Bahamas
-
 Bahrain
-
 Bangladesh
-
 Belarus
-
 Belgium
-
 Bolivia
-
 Botswana
-
 Brazil
-
 Brunei
-
 Bulgaria
-
 Cambodia
-
 Cameroon
-
 Canada
-
 Chile
-
 China
-
 Colombia
-
 Congo
-
 Costa Rica
-
 Cote d'Ivoire
-
 Croatia
-
 Cuba
-
 Cyprus
-
 Czechia
-
 DR Congo
-
 Denmark
-
 Dominican Republic
-
 Ecuador
-
 Egypt
-
 El Salvador
-
 Estonia
-
 Eswatini
-
 Ethiopia
-
 Finland
-
 France
-
 Georgia
-
 Germany
-
 Ghana
-
 Greece
-
 Haiti
-
 Hong Kong
-
 Hungary
-
 India
-
 Indonesia
-
 Iran, Islamic republic
-
 Iraq
-
 Ireland
-
 Israel
-
 Italy
-
 Jamaica
-
 Japan
-
 Jordan
-
 Kazakhstan
-
 Kenya
-
 Korea
-
 Kuwait
-
 Kyrgyzstan
-
 Laos
-
 Latvia
-
 Lebanon
-
 Lesotho
-
 Libya
-
 Lithuania
-
 Luxembourg
-
 Madagascar
-
 Malaysia
-
 Malta
-
 Mauritius
-
 Mexico
-
 Moldova
-
 Mongolia
-
 Montenegro
-
 Morocco
-
 Mozambique
-
 Myanmar
-
 Namibia
-
 Nepal
-
 Netherlands
-
 New Zealand
-
 Nigeria
-
 North Macedonia
-
 Norway
-
 Oman
-
 Pakistan
-
 Palestine
-
 Panama
-
 Papua New Guinea
-
 Paraguay
-
 Peru
-
 Philippines
-
 Poland
-
 Portugal
-
 Puerto Rico
-
 Qatar
-
 Reunion
-
 Romania
-
 Rwanda
-
 Saudi Arabia
-
 Serbia
-
 Singapore
-
 Slovakia
-
 Slovenia
-
 Somalia
-
 South Africa
-
 Spain
-
 Sri Lanka
-
 Sweden
-
 Switzerland
-
 Syria
-
 Taiwan
-
 Tajikistan
-
 Tanzania
-
 Thailand
-
 Trinidad and Tobago
-
 Tunisia
-
 Turkey
-
 UAE
-
 Uganda
-
 Ukraine
-
 United Kingdom
-
United States
-
 Uruguay
-
 Uzbekistan
-
 Venezuela
-
 Vietnam
-
 Yemen
-
 Zambia
-
 Zimbabwe
- Forex
- Crypto












