

Netflix shares technical analysis: Downward price move as weak momentum persists

Netflix (NFLX) stock is trading at $65.69, down 4.35% on the day, and is currently positioned below its key moving averages, indicating sustained downward pressure.
 62.89
63.27
Highlights
- Netflix reported Q3 2026 revenue of $12.87 billion and adjusted earnings per share of $0.87, both exceeding consensus estimates.
- The company cut 1,000 jobs, about 6% of its workforce, to fund investments in live sports and advertising, with ad revenue up over 80% year-over-year.
- Shares of Netflix have dropped 4.35% to $65.69, trading below key moving averages, with indicators pointing to strong downside momentum and an expected range of $63.53 to $68.38.
Cautious investor outlook despite revenue beat and workforce cuts
Netflix reported $12.87 billion in sales and adjusted earnings per share of $0.87 for Q3 2026, both surpassing consensus expectations, according to CNBC and Yahoo Finance. Despite these outperformance figures, the company implemented a 1,000-job reduction, about 6% of its workforce, as part of a restructuring effort to invest more in live sports and advertising, as reported by Investing.com. Strong growth in advertising revenue, which rose over 80% year-over-year in Q3 2026 based on TradingKey data, was accompanied by increased engagement in France through the recently launched TF1 content partnership, and solid international gains with India revenue up nearly 20%. Broader investor sentiment, however, remained cautious following updated guidance for Q4 and full-year advertising sales — despite pockets of operational strength.
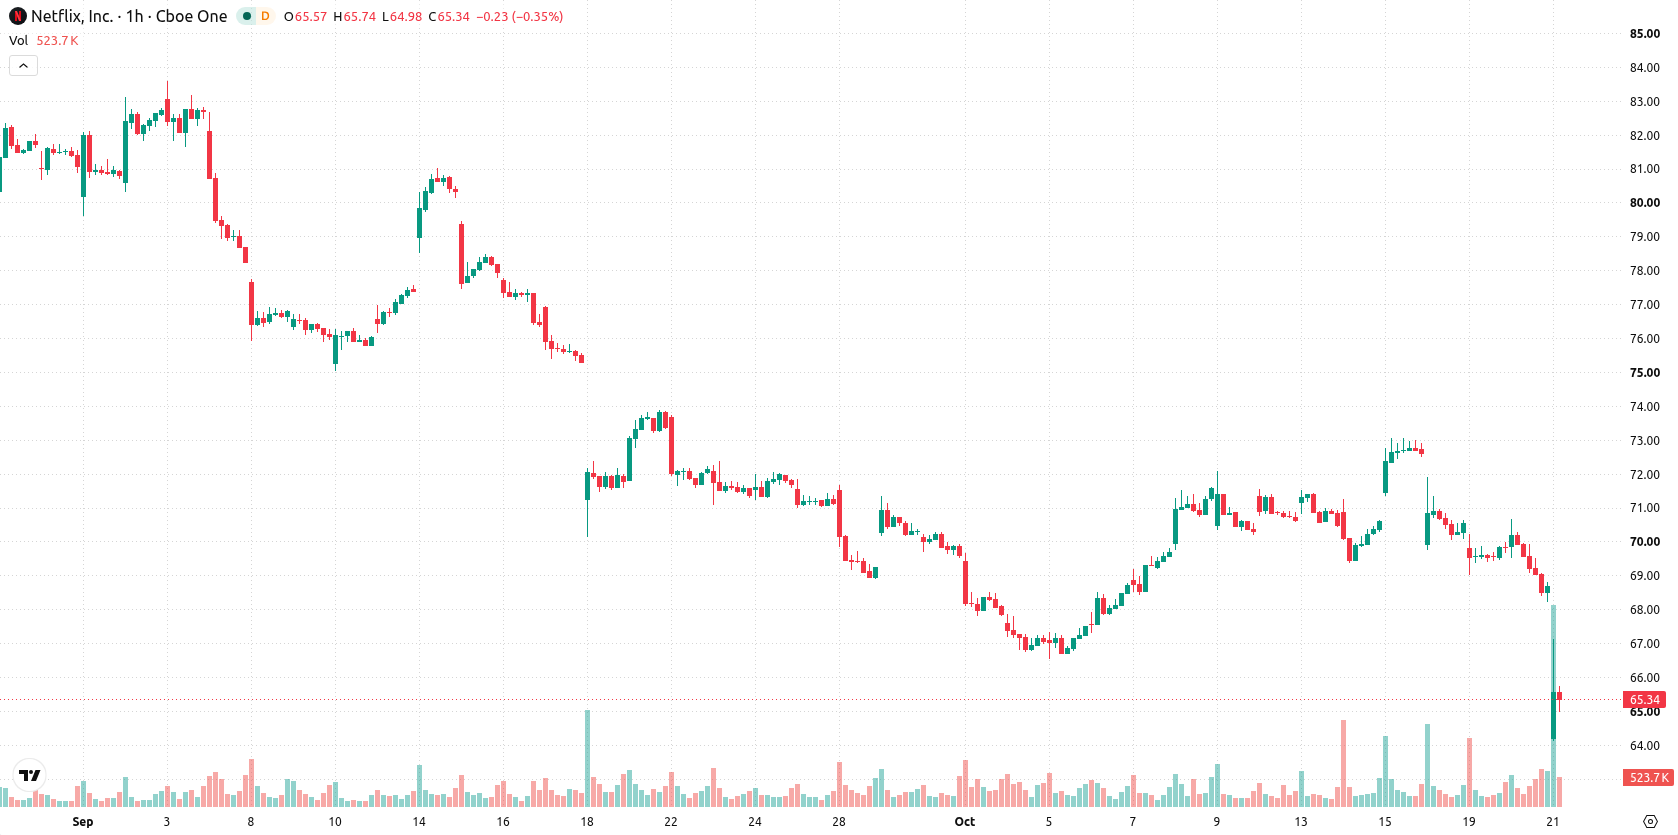
Bearish momentum confirmed as price breaks major support levels
On the technical front, NFLX/USD is trading below the MA-20 and MA-50 on the hourly chart, as well as under the MA-200 on the daily timeframe. The Ichimoku Kijun at $68.42 establishes immediate resistance, while support is noted near $63.53. Momentum indicators confirm a strong downward trend, with MACD and ADX signaling pronounced seller control. RSI, Stochastic RSI, and CCI all indicate oversold conditions, and Bull/Bear Power supports this intraday bearish momentum. The Awesome Oscillator also aligns with ongoing negative sentiment.
Lower breakout risk heightened amid strong negative trend signals
In the short term, price action is expected to remain volatile within the $63.53 to $68.38 range. The probability of a rebound above resistance at $68.42 appears very low, while continued downside below $63.53 remains highly plausible. Stabilization within the current range forms the baseline scenario given prevailing momentum and trend signals.
Earlier, analysts noted that despite Netflix's continued revenue growth and strategic positioning, concerns were emerging regarding its ability to maintain an edge over rising competition. The current technical setup adds a new dimension, highlighting that persistent selling pressure and oversold conditions now make downside moves below key support increasingly likely, with volatility poised to intensify if the $63.53 level breaks.











-
 Afghanistan
-
 Albania
-
 Algeria
-
 Angola
-
 Argentina
-
 Armenia
-
 Australia
-
 Austria
-
 Azerbaijan
-
 Bahamas
-
 Bahrain
-
 Bangladesh
-
 Belarus
-
 Belgium
-
 Bolivia
-
 Botswana
-
 Brazil
-
 Brunei
-
 Bulgaria
-
 Cambodia
-
 Cameroon
-
 Canada
-
 Chile
-
 China
-
 Colombia
-
 Congo
-
 Costa Rica
-
 Cote d'Ivoire
-
 Croatia
-
 Cuba
-
 Cyprus
-
 Czechia
-
 DR Congo
-
 Denmark
-
 Dominican Republic
-
 Ecuador
-
 Egypt
-
 El Salvador
-
 Estonia
-
 Eswatini
-
 Ethiopia
-
 Finland
-
 France
-
 Georgia
-
 Germany
-
 Ghana
-
 Greece
-
 Haiti
-
 Hong Kong
-
 Hungary
-
 India
-
 Indonesia
-
 Iran, Islamic republic
-
 Iraq
-
 Ireland
-
 Israel
-
 Italy
-
 Jamaica
-
 Japan
-
 Jordan
-
 Kazakhstan
-
 Kenya
-
 Korea
-
 Kuwait
-
 Kyrgyzstan
-
 Laos
-
 Latvia
-
 Lebanon
-
 Lesotho
-
 Libya
-
 Lithuania
-
 Luxembourg
-
 Madagascar
-
 Malaysia
-
 Malta
-
 Mauritius
-
 Mexico
-
 Moldova
-
 Mongolia
-
 Montenegro
-
 Morocco
-
 Mozambique
-
 Myanmar
-
 Namibia
-
 Nepal
-
 Netherlands
-
 New Zealand
-
 Nigeria
-
 North Macedonia
-
 Norway
-
 Oman
-
 Pakistan
-
 Palestine
-
 Panama
-
 Papua New Guinea
-
 Paraguay
-
 Peru
-
 Philippines
-
 Poland
-
 Portugal
-
 Puerto Rico
-
 Qatar
-
 Reunion
-
 Romania
-
 Rwanda
-
 Saudi Arabia
-
 Serbia
-
 Singapore
-
 Slovakia
-
 Slovenia
-
 Somalia
-
 South Africa
-
 Spain
-
 Sri Lanka
-
 Sweden
-
 Switzerland
-
 Syria
-
 Taiwan
-
 Tajikistan
-
 Tanzania
-
 Thailand
-
 Trinidad and Tobago
-
 Tunisia
-
 Turkey
-
 UAE
-
 Uganda
-
 Ukraine
-
 United Kingdom
-
United States
-
 Uruguay
-
 Uzbekistan
-
 Venezuela
-
 Vietnam
-
 Yemen
-
 Zambia
-
 Zimbabwe
- Forex
- Crypto












