


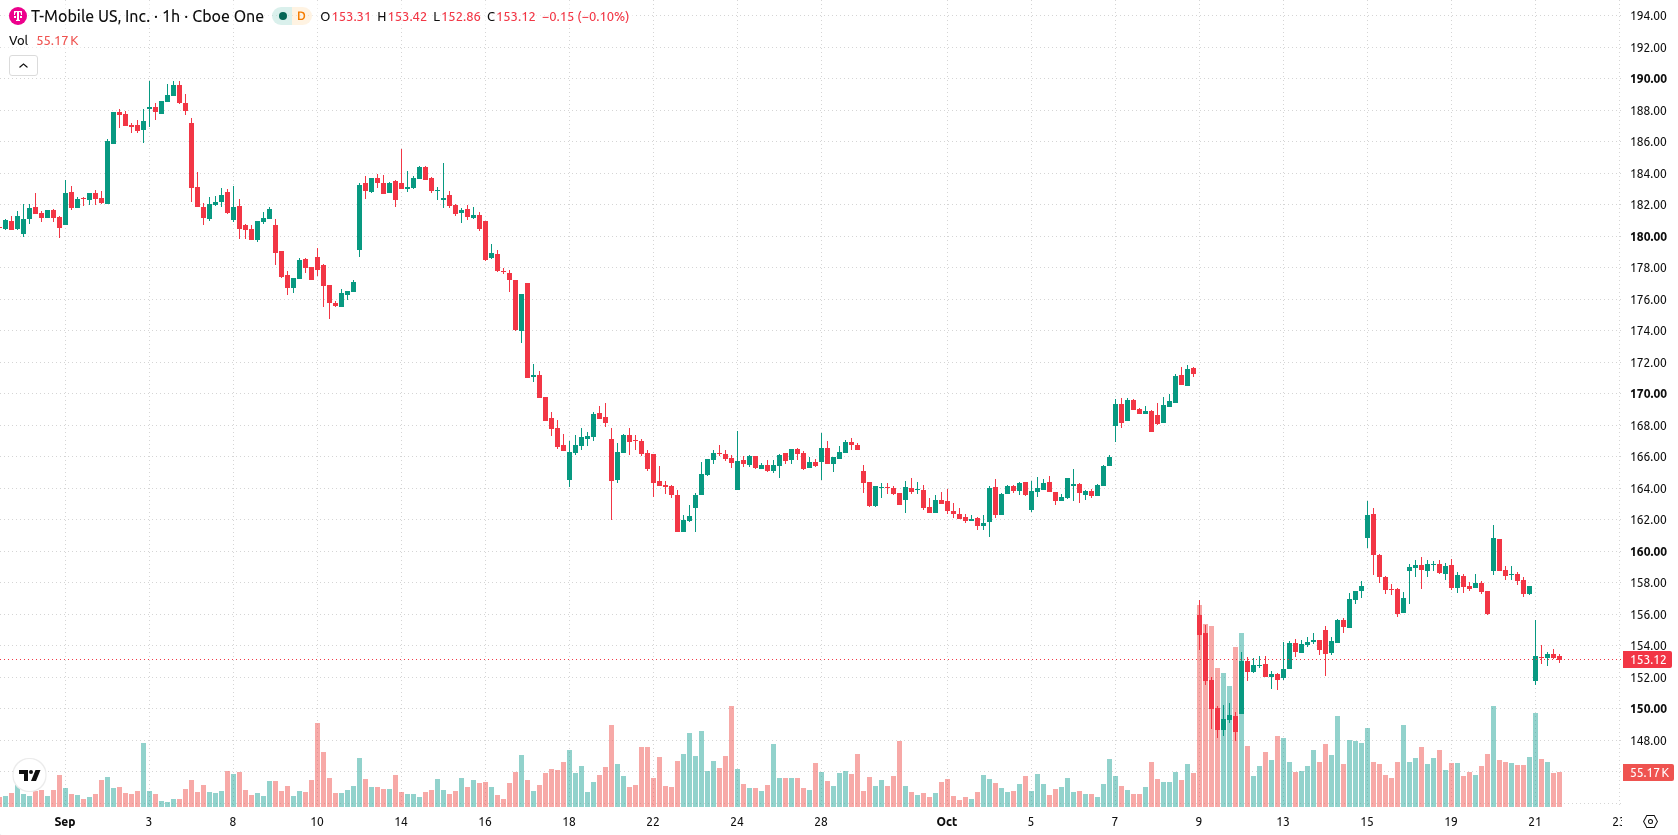
T-Mobile US, Inc. (TMUS) stock is trading at $152.97 after a daily decline of 3.04%. The price is currently below its key moving averages, reflecting a period of moderate downward momentum.
 163.30
Highlights
- T-Mobile spent $2,560,000 on lobbying in Q3 2026 focused on spectrum swaps, tax reform, data privacy, and broadband deployment.
- These lobbying efforts target regulatory factors likely to impact long-term operational flexibility and future cost structures, with limited near-term stock impact so far.
- Shares of T-Mobile fell 3.04% to $152.97, with bearish signals across major indicators and an expected range of $149.73 to $156.21 over the coming days.
Lobbying spend rises as regulatory strategy yields muted price effect
T-Mobile disclosed $2,560,000 in lobbying expenses during the third quarter of 2026, targeting spectrum swaps, tax reform, data privacy, and broadband deployment, according to Quiverquant. These expenditures reflect ongoing efforts to influence regulatory conditions that affect operational flexibility and future cost structures. While such actions may shape the company's long-term market position, they have delivered only limited short-term impact on current price action.
Mixed momentum and technical resistance signal indecision for TMUS
On the technical side, TMUS is trading below both its MA-20 at $158.34 and MA-50 at $156.41 on the hourly chart, with the daily price well beneath the long-term MA-200 at $188.81. The Ichimoku Kijun on the daily chart marks immediate resistance at $158.69. Intraday signals are mixed: the MACD shows strong buy momentum, while RSI at 49.33 favors selling, CCI remains in sell territory, and Bull/Bear Power is oversold. ADX, Stochastic RSI, and the Awesome Oscillator all register neutral readings, highlighting a lack of clear trend direction and a persistent divergence among momentum indicators.
Bearish bias prevails as range narrows and breakout risk looms
Short term, TMUS is projected to trade between $149.73 and $156.21 over the next few sessions, with a 74% probability of further decline and only a 26% chance of a sustained rebound. The baseline outlook envisions consolidation within this range. A bullish breakout would require a close above the $158.69 resistance, while a continued bearish move would be confirmed by a solid break below $149.73.
Earlier, analysts noted that heightened competitive pressures and persistent bearish momentum had placed T-Mobile under sustained downside risk. The current analysis adds a new dimension by highlighting the company's significant lobbying efforts amid ongoing technical indecision, with traders advised to monitor the $149.73 support as a potential trigger for renewed weakness.









-
 Afghanistan
-
 Albania
-
 Algeria
-
 Angola
-
 Argentina
-
 Armenia
-
 Australia
-
 Austria
-
 Azerbaijan
-
 Bahamas
-
 Bahrain
-
 Bangladesh
-
 Belarus
-
 Belgium
-
 Bolivia
-
 Botswana
-
 Brazil
-
 Brunei
-
 Bulgaria
-
 Cambodia
-
 Cameroon
-
 Canada
-
 Chile
-
 China
-
 Colombia
-
 Congo
-
 Costa Rica
-
 Cote d'Ivoire
-
 Croatia
-
 Cuba
-
 Cyprus
-
 Czechia
-
 DR Congo
-
 Denmark
-
 Dominican Republic
-
 Ecuador
-
 Egypt
-
 El Salvador
-
 Estonia
-
 Eswatini
-
 Ethiopia
-
 Finland
-
 France
-
 Georgia
-
 Germany
-
 Ghana
-
 Greece
-
 Haiti
-
 Hong Kong
-
 Hungary
-
 India
-
 Indonesia
-
 Iran, Islamic republic
-
 Iraq
-
 Ireland
-
 Israel
-
 Italy
-
 Jamaica
-
 Japan
-
 Jordan
-
 Kazakhstan
-
 Kenya
-
 Korea
-
 Kuwait
-
 Kyrgyzstan
-
 Laos
-
 Latvia
-
 Lebanon
-
 Lesotho
-
 Libya
-
 Lithuania
-
 Luxembourg
-
 Madagascar
-
 Malaysia
-
 Malta
-
 Mauritius
-
 Mexico
-
 Moldova
-
 Mongolia
-
 Montenegro
-
 Morocco
-
 Mozambique
-
 Myanmar
-
 Namibia
-
 Nepal
-
 Netherlands
-
 New Zealand
-
 Nigeria
-
 North Macedonia
-
 Norway
-
 Oman
-
 Pakistan
-
 Palestine
-
 Panama
-
 Papua New Guinea
-
 Paraguay
-
 Peru
-
 Philippines
-
 Poland
-
 Portugal
-
 Puerto Rico
-
 Qatar
-
 Reunion
-
 Romania
-
 Rwanda
-
 Saudi Arabia
-
 Serbia
-
 Singapore
-
 Slovakia
-
 Slovenia
-
 Somalia
-
 South Africa
-
 Spain
-
 Sri Lanka
-
 Sweden
-
 Switzerland
-
 Syria
-
 Taiwan
-
 Tajikistan
-
 Tanzania
-
 Thailand
-
 Trinidad and Tobago
-
 Tunisia
-
 Turkey
-
 UAE
-
 Uganda
-
 Ukraine
-
 United Kingdom
-
United States
-
 Uruguay
-
 Uzbekistan
-
 Venezuela
-
 Vietnam
-
 Yemen
-
 Zambia
-
 Zimbabwe
- Forex
- Crypto












