

T-Mobile stock rebounds as oversold conditions spark recovery attempt

T-Mobile US (TMUS) stock is trading at $153.12, up 3.09% on the day. The price remains below its key moving averages, reflecting ongoing downward pressure despite today’s intraday rebound.
 154.75
171.76
154.75
171.76
Highlights
- T-Mobile US faces immediate competitive headwinds after SpaceX formally entered the telecom sector, creating uncertainty around future market share.
- Investors are reassessing growth prospects for T-Mobile stock as the industry landscape undergoes structural changes driven by new entrants.
- Shares of T-Mobile trade below key moving averages, with technical indicators bearish and a projected range of $142.45 to $163.79.
Competitive headwinds mount as SpaceX disrupts telecom landscape
T-Mobile US has come under pressure following SpaceX's formal entry into the telecom sector, a move that created immediate competitive headwinds, according to Yahoo Finance. This heightened competition has prompted a sharp reassessment of T-Mobile's prospects as investors weigh the potential impact on future market share and growth. Today’s market activity reflects an ongoing adjustment to these structural changes in the industry landscape.
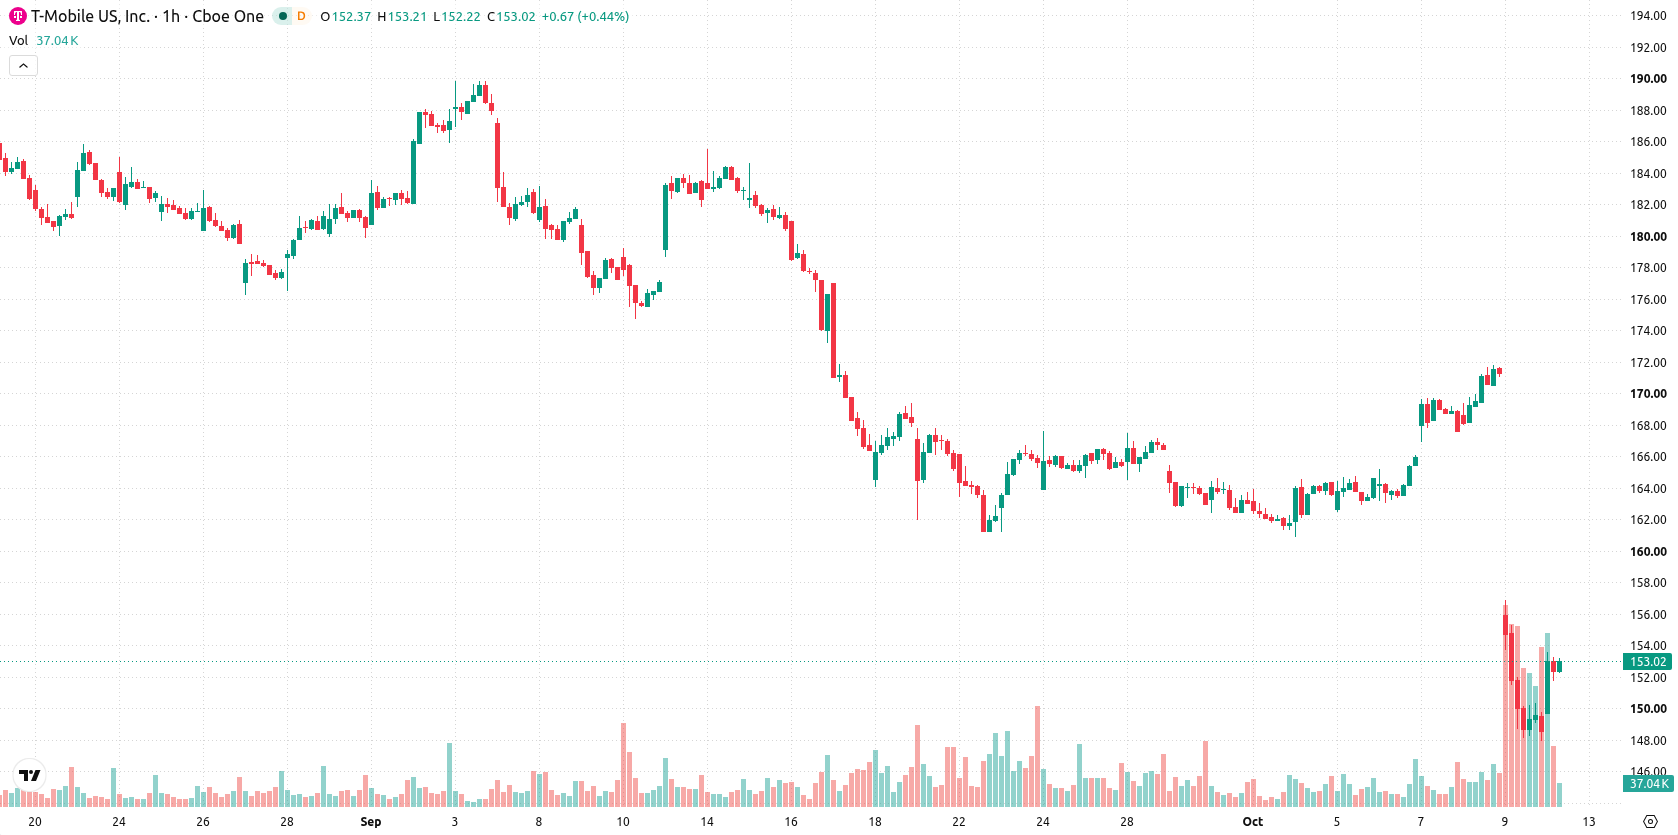
Bearish momentum deepens as key indicators and resistance align
TMUS is trading below the MA-20, MA-50, and MA-200 levels, with the Ichimoku Kijun at $159.85 acting as immediate resistance. Hourly momentum indicators, including MACD and ADX, are both generating sell signals, while RSI registers at 21.82 and both Stoch RSI and CCI are deep in oversold territory. Bull/Bear Power readings confirm sellers dominate intraday activity, and the Awesome Oscillator is negative, aligning with the current bearish momentum.
Volatile range persists with downside risk and defined triggers
In the short term, TMUS is expected to trade between $142.45 and $163.79, reflecting a typical volatility band relative to current levels. There is a 68% probability of continued downside, while an upside move holds a 32% likelihood. Price may fluctuate sideways within this range, with a bullish scenario emerging only if the stock reclaims and holds above the $159.85 resistance; conversely, a breach of support at $142.45 could trigger further weakness.
Earlier, analysts noted that SpaceX's entry into the wireless sector had intensified competitive pressures and highlighted downside risks for T-Mobile. The current analysis reinforces this view, as continued bearish momentum and deep oversold conditions suggest the $142.45 support level is now critical to monitor for potential further weakness.









-
 Afghanistan
-
 Albania
-
 Algeria
-
 Angola
-
 Argentina
-
 Armenia
-
 Australia
-
 Austria
-
 Azerbaijan
-
 Bahamas
-
 Bahrain
-
 Bangladesh
-
 Belarus
-
 Belgium
-
 Bolivia
-
 Botswana
-
 Brazil
-
 Brunei
-
 Bulgaria
-
 Cambodia
-
 Cameroon
-
 Canada
-
 Chile
Chile
-
 China
China
-
 Colombia
-
 Congo
Congo
-
 Costa Rica
-
 Cote d'Ivoire
-
 Croatia
-
 Cuba
Cuba
-
 Cyprus
-
 Czechia
-
 DR Congo
-
 Denmark
-
 Dominican Republic
-
 Ecuador
-
 Egypt
Egypt
-
 El Salvador
-
 Estonia
-
 Eswatini
-
 Ethiopia
-
 Finland
-
 France
-
 Georgia
-
 Germany
-
 Ghana
Ghana
-
 Greece
-
 Haiti
Haiti
-
 Hong Kong
-
 Hungary
-
 India
India
-
 Indonesia
-
 Iran, Islamic republic
-
 Iraq
Iraq
-
 Ireland
-
 Israel
-
 Italy
Italy
-
 Jamaica
-
 Japan
Japan
-
 Jordan
-
 Kazakhstan
-
 Kenya
Kenya
-
 Korea
Korea
-
 Kuwait
-
 Kyrgyzstan
-
 Laos
Laos
-
 Latvia
-
 Lebanon
-
 Lesotho
-
 Libya
Libya
-
 Lithuania
-
 Luxembourg
-
 Madagascar
-
 Malaysia
-
 Malta
Malta
-
 Mauritius
-
 Mexico
-
 Moldova
-
 Mongolia
-
 Montenegro
-
 Morocco
-
 Mozambique
-
 Myanmar
-
 Namibia
-
 Nepal
Nepal
-
 Netherlands
-
 New Zealand
-
 Nigeria
-
 North Macedonia
-
 Norway
-
 Oman
Oman
-
 Pakistan
-
 Palestine
-
 Panama
-
 Papua New Guinea
-
 Paraguay
-
 Peru
Peru
-
 Philippines
-
 Poland
-
 Portugal
-
 Puerto Rico
-
 Qatar
Qatar
-
 Reunion
-
 Romania
-
 Rwanda
-
 Saudi Arabia
-
 Serbia
-
 Singapore
-
 Slovakia
-
 Slovenia
-
 Somalia
-
 South Africa
-
 Spain
Spain
-
 Sri Lanka
-
 Sweden
-
 Switzerland
-
 Syria
Syria
-
 Taiwan
-
 Tajikistan
-
 Tanzania
-
 Thailand
-
 Trinidad and Tobago
-
 Tunisia
-
 Turkey
-
 UAE
UAE
-
 Uganda
-
 Ukraine
-
 United Kingdom
-
United States
-
 Uruguay
-
 Uzbekistan
-
 Venezuela
-
 Vietnam
-
 Yemen
Yemen
-
 Zambia
-
 Zimbabwe
- Forex
- Crypto












