

T-Mobile shares technical analysis: Support pressure builds at $162.74

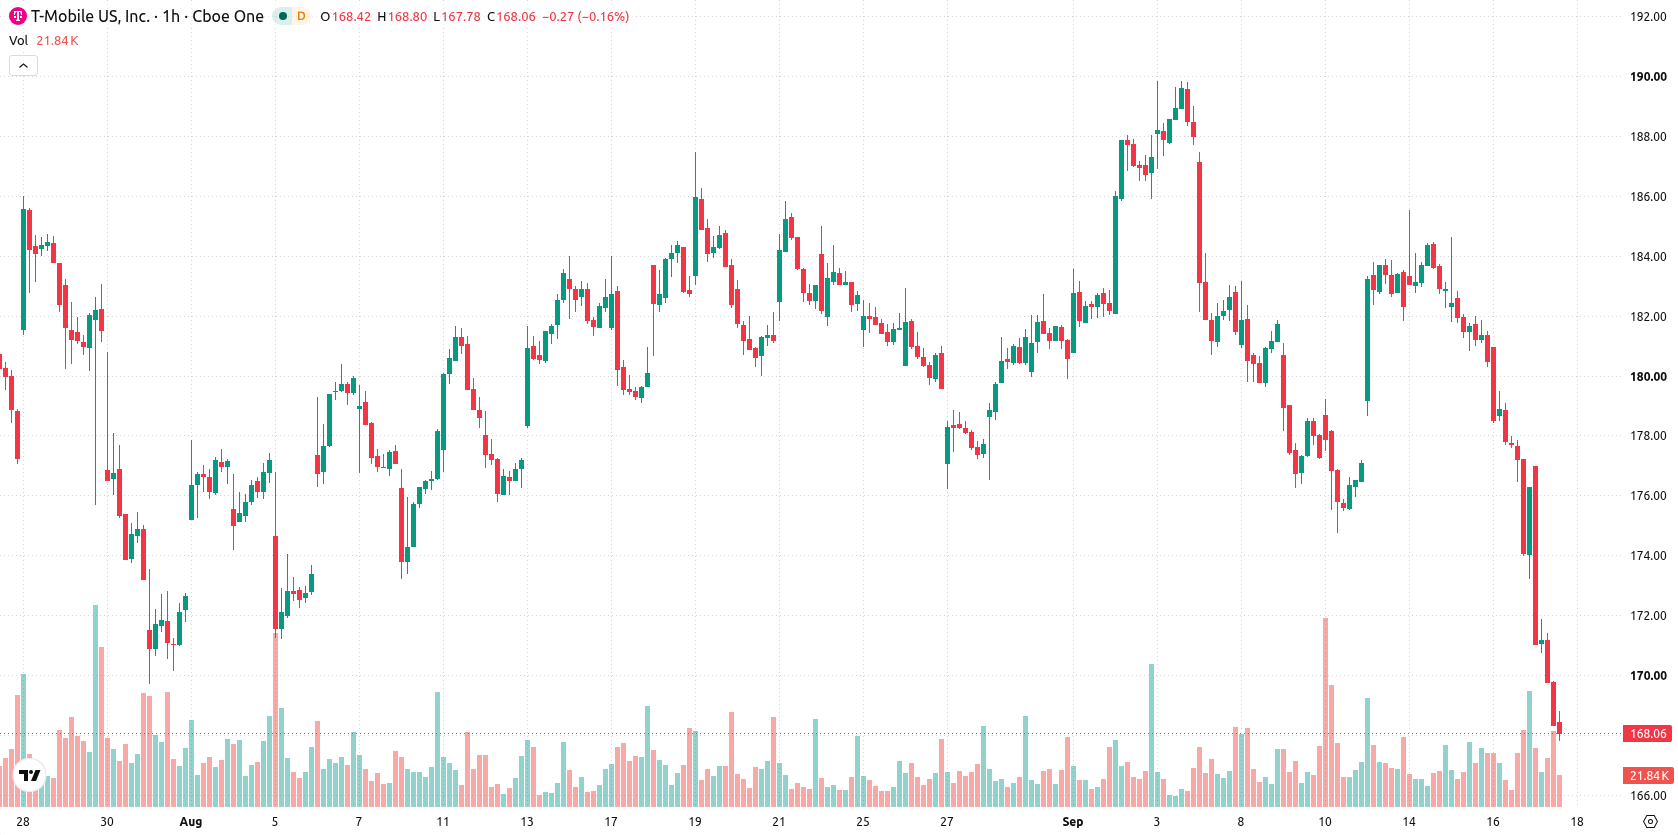
T-Mobile US (TMUS) stock is trading at $167.9 in the latest session, down 4.66% for the day. The stock is positioned below its key moving averages, signaling a strong downward move amid moderate volatility.
 158.97
Highlights
- T-Mobile US raised full-year free cash flow guidance to $18.4 billion to $18.8 billion after strong Q2 2026 results.
- Postpaid service revenue rose 13% year over year with 277,000 net new postpaid accounts and a record Net Promoter Score of 46.
- Shares of T-Mobile trade at $167.9, down 4.66% for the day, remaining below key moving averages with intraday momentum signaling strong bearish control; price is forecast to range between $162.74 and $173.06 in the near term.
Subscriber growth and cash flow guidance drive optimism amid selling
T-Mobile US raised its full-year free cash flow guidance to $18.4–$18.8 billion following Q2 2026 results, which featured a 13% year-over-year increase in postpaid service revenue and a 9% rise in total service revenue, as well as 277,000 net new postpaid accounts and a record Net Promoter Score of 46 for the quarter, according to Scanx. These indicators highlight robust subscriber momentum and improving operational efficiency, factors that would typically support valuation strength. The company also announced it will host its Q3 2026 earnings call on October 28, 2026, as reported by Stockhouse, providing a scheduled catalyst for future updates — though price action has remained under broader selling pressure.
Key moving averages breached as bearish momentum dominates indicators
TMUS is trading beneath the MA-20 at $180.58 and MA-50 at $180.09 on the hourly chart, with its price also below the MA-200 at $193.55 on the daily timeframe. Immediate resistance is located at the Ichimoku Kijun level of $179.4, while price action remains close to today's low. Indicators reflect a generally bearish momentum: MACD displays a sell bias and the RSI stands at 35.07, both signaling downside, although the Stoch RSI flashes a strong buy and the CCI is oversold. Bull/Bear Power remains negative, and the Awesome Oscillator confirms the prevailing downtrend, while ADX is neutral.
Rangebound outlook with downside bias on elevated volatility
In the near term, TMUS is forecast to fluctuate within a band between $162.74 and $173.06, reflecting typical volatility relative to current levels. Downside probability is assessed at 71%, suggesting a broad bias for continued soft trading; any substantial upward move would require a clear break above the $179.4 resistance level. Conversely, a decisive slide below $162.74 support could trigger further downside acceleration. The baseline expectation is for price to consolidate sideways within this range over the coming sessions.
Earlier, analysts noted that T-Mobile faced mixed technical signals, with short-term gains offset by underlying momentum weakness, leading to expectations of further sideways price movement. The latest breakdown below key moving averages confirms this cautious stance, and attention now turns to whether T-Mobile can hold above $162.74 support or risk further declines if that level is breached.









-
 Afghanistan
-
 Albania
-
 Algeria
-
 Angola
-
 Argentina
-
 Armenia
-
 Australia
-
 Austria
-
 Azerbaijan
-
 Bahamas
-
 Bahrain
-
 Bangladesh
-
 Belarus
-
 Belgium
-
 Bolivia
-
 Botswana
-
 Brazil
-
 Brunei
-
 Bulgaria
-
 Cambodia
-
 Cameroon
-
 Canada
-
 Chile
-
 China
-
 Colombia
-
 Congo
-
 Costa Rica
-
 Cote d'Ivoire
-
 Croatia
-
 Cuba
-
 Cyprus
-
 Czechia
-
 DR Congo
-
 Denmark
-
 Dominican Republic
-
 Ecuador
-
 Egypt
-
 El Salvador
-
 Estonia
-
 Eswatini
-
 Ethiopia
-
 Finland
-
 France
-
 Georgia
-
 Germany
-
 Ghana
-
 Greece
-
 Haiti
-
 Hong Kong
-
 Hungary
-
 India
-
 Indonesia
-
 Iran, Islamic republic
-
 Iraq
-
 Ireland
-
 Israel
-
 Italy
-
 Jamaica
-
 Japan
-
 Jordan
-
 Kazakhstan
-
 Kenya
-
 Korea
-
 Kuwait
-
 Kyrgyzstan
-
 Laos
-
 Latvia
-
 Lebanon
-
 Lesotho
-
 Libya
-
 Lithuania
-
 Luxembourg
-
 Madagascar
-
 Malaysia
-
 Malta
-
 Mauritius
-
 Mexico
-
 Moldova
-
 Mongolia
-
 Montenegro
-
 Morocco
-
 Mozambique
-
 Myanmar
-
 Namibia
-
 Nepal
-
 Netherlands
-
 New Zealand
-
 Nigeria
-
 North Macedonia
-
 Norway
-
 Oman
-
 Pakistan
-
 Palestine
-
 Panama
-
 Papua New Guinea
-
 Paraguay
-
 Peru
-
 Philippines
-
 Poland
-
 Portugal
-
 Puerto Rico
-
 Qatar
-
 Reunion
-
 Romania
-
 Rwanda
-
 Saudi Arabia
-
 Serbia
-
 Singapore
-
 Slovakia
-
 Slovenia
-
 Somalia
-
 South Africa
-
 Spain
-
 Sri Lanka
-
 Sweden
-
 Switzerland
-
 Syria
-
 Taiwan
-
 Tajikistan
-
 Tanzania
-
 Thailand
-
 Trinidad and Tobago
-
 Tunisia
-
 Turkey
-
 UAE
-
 Uganda
-
 Ukraine
-
 United Kingdom
-
United States
-
 Uruguay
-
 Uzbekistan
-
 Venezuela
-
 Vietnam
-
 Yemen
-
 Zambia
-
 Zimbabwe
- Forex
- Crypto












