

WMB climbs around 3.5% after rally despite negative technical momentum

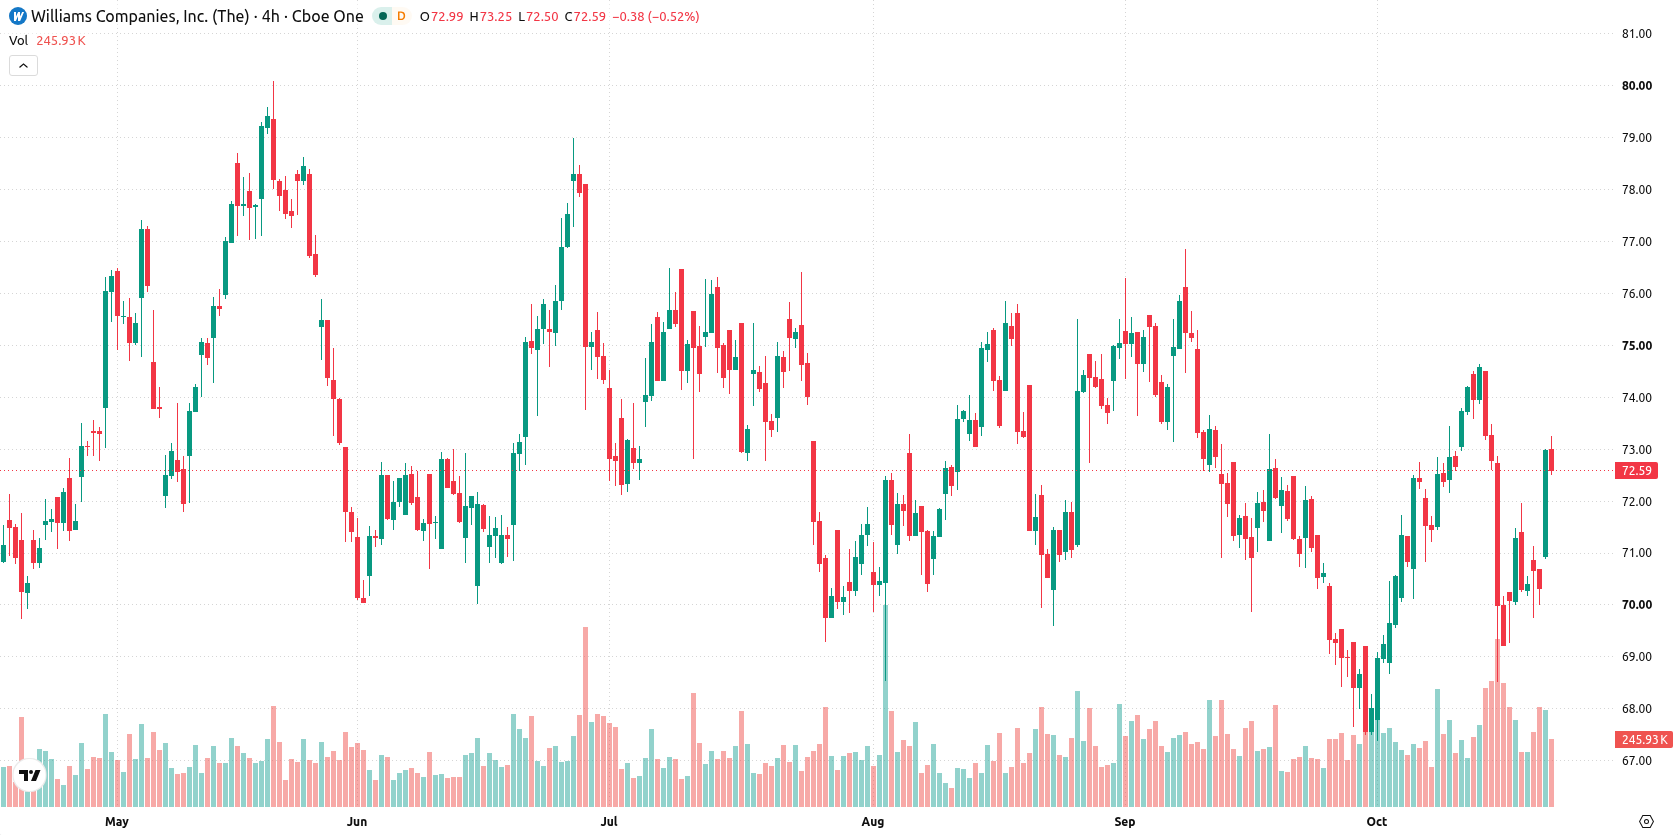
The Williams Companies, Inc. (WMB) surged 3.55% in a strong upside session, driven by bullish short-term price action and an upside price gap. This advance contradicts broadly negative momentum signals, as the move occurred even with multiple technical indicators flagging weak trend conviction.
 76.00
76.00
Highlights
- Williams Companies stock trades above key moving averages, indicating sustained strength across multiple timeframes.
- Momentum indicators such as MACD and RSI show a sell setup, with trend signals mostly neutral and BBP suggesting seller dominance.
- The expected five-day price range is $70.73 to $75.82, with a 21% probability of upside and 79% probability of downside.
Divergent momentum as price strength challenges persistent sell signals
Williams Companies is trading above its 20-day, 50-day, and 200-day moving averages ($70.94, $72.26, and $71.92), suggesting supportive trends across all timeframes. The nearest ceiling for the stock is the recent week high at $72.89, while the 50-day moving average at $72.26 provides the first nearby floor. Momentum signals remain weak, with the MACD and RSI both indicating a sell setup, and the ADX showing neutral trend strength. The Stochastic RSI and CCI are neutral, but Bull/Bear Power (BBP) suggests mild seller dominance and flags an oversold reading. The stock gained $2.50 or 3.55% today after an upside gap of about 1.12%, with price closing near session highs and intraday volatility at 2.77%. This strong finish toward the highs contradicts the generally negative momentum setup, highlighting a divergence between short-term price action and indicator readings.
Earlier, analysts noted that Williams Companies’ outlook remained constructive amid strong institutional buying and supportive momentum trends. The current divergence between weak momentum signals and resilient price action introduces greater uncertainty, making the $72.89 resistance level a critical threshold for either confirming renewed upside or signaling further consolidation.






Latest Williams Companies News



-
 Afghanistan
-
 Albania
-
 Algeria
-
 Angola
-
 Argentina
-
 Armenia
-
 Australia
-
 Austria
-
 Azerbaijan
-
 Bahamas
-
 Bahrain
-
 Bangladesh
-
 Belarus
-
 Belgium
-
 Bolivia
-
 Botswana
-
 Brazil
-
 Brunei
-
 Bulgaria
-
 Cambodia
-
 Cameroon
-
 Canada
-
 Chile
-
 China
-
 Colombia
-
 Congo
-
 Costa Rica
-
 Cote d'Ivoire
-
 Croatia
-
 Cuba
-
 Cyprus
-
 Czechia
-
 DR Congo
-
 Denmark
-
 Dominican Republic
-
 Ecuador
-
 Egypt
-
 El Salvador
-
 Estonia
-
 Eswatini
-
 Ethiopia
-
 Finland
-
 France
-
 Georgia
-
 Germany
-
 Ghana
-
 Greece
-
 Haiti
-
 Hong Kong
-
 Hungary
-
 India
-
 Indonesia
-
 Iran, Islamic republic
-
 Iraq
-
 Ireland
-
 Israel
-
 Italy
-
 Jamaica
-
 Japan
-
 Jordan
-
 Kazakhstan
-
 Kenya
-
 Korea
-
 Kuwait
-
 Kyrgyzstan
-
 Laos
-
 Latvia
-
 Lebanon
-
 Lesotho
-
 Libya
-
 Lithuania
-
 Luxembourg
-
 Madagascar
-
 Malaysia
-
 Malta
-
 Mauritius
-
 Mexico
-
 Moldova
-
 Mongolia
-
 Montenegro
-
 Morocco
-
 Mozambique
-
 Myanmar
-
 Namibia
-
 Nepal
-
 Netherlands
-
 New Zealand
-
 Nigeria
-
 North Macedonia
-
 Norway
-
 Oman
-
 Pakistan
-
 Palestine
-
 Panama
-
 Papua New Guinea
-
 Paraguay
-
 Peru
-
 Philippines
-
 Poland
-
 Portugal
-
 Puerto Rico
-
 Qatar
-
 Reunion
-
 Romania
-
 Rwanda
-
 Saudi Arabia
-
 Serbia
-
 Singapore
-
 Slovakia
-
 Slovenia
-
 Somalia
-
 South Africa
-
 Spain
-
 Sri Lanka
-
 Sweden
-
 Switzerland
-
 Syria
-
 Taiwan
-
 Tajikistan
-
 Tanzania
-
 Thailand
-
 Trinidad and Tobago
-
 Tunisia
-
 Turkey
-
 UAE
-
 Uganda
-
 Ukraine
-
 United Kingdom
-
United States
-
 Uruguay
-
 Uzbekistan
-
 Venezuela
-
 Vietnam
-
 Yemen
-
 Zambia
-
 Zimbabwe
- Forex
- Crypto












