

Unilever shares technical analysis: Downward price move amid oversold market signals

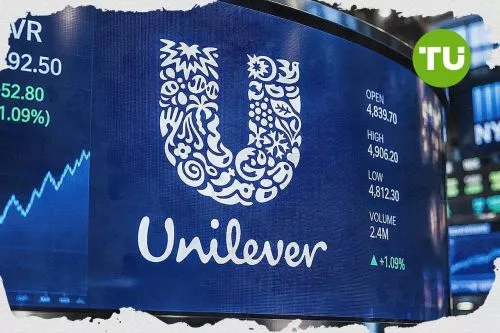
Unilever (ULVR) stock is trading at GBX4,821.50, down 1.67% on the day. The stock currently sits below its key moving averages, reflecting continued pressure in the near term.
 5037.00
Highlights
- Shares of Unilever moved above the 200-day moving average, indicating increased institutional attention and trend-following activity.
- Broader selling pressure continues to limit upward momentum, even as mechanical flows may boost near-term demand for the stock.
- Technical indicators show persistent seller control, with price expected to range from GBX4,719 to GBX4,923 over the next 2 to 3 days.
Institutional buying increases as 200-day breakout triggers mechanical flows
Unilever shares recently passed above their 200-day moving average, a technical milestone documented by Defenseworld. Such breakouts can trigger mechanical buying from trend-following funds and signal potential shifts in market participation, typically enhancing near-term demand. This development suggests that institutional flows may have increased, though price action has remained under broader selling pressure.
Bearish momentum intensifies as price stays under short-term resistance
On the H1 chart, the price remains below both the MA-20 at GBX4,877 and MA-50 at GBX4,882, highlighting ongoing short- and medium-term weakness. The long-term MA-200 at GBX4,642 provides underlying support, while the Ichimoku Kijun line at GBX4,839 marks immediate resistance. Momentum indicators confirm the bearish tone: MACD and ADX both show a persistent sell bias, RSI registers a low 36.09, and Stoch RSI, CCI, and Bull/Bear Power all point to oversold or seller-dominated conditions. The Awesome Oscillator reading is also negative, confirming that selling momentum is still strong.
Rangebound trading expected as downside risks outweigh reversal odds
Over the next several sessions, price is expected to fluctuate within a volatility band of GBX4,719 to GBX4,923. The probability-weighted scenario points toward a 64% chance of a downward move, with a lesser 36% likelihood of an upward retracement. The baseline expectation is for price to churn sideways inside this range unless a clear breakout above resistance or breakdown below support occurs.
Previously it was reported that McCormick & Company is seeking to acquire a controlling stake in Unilever Pakistan Foods Limited as part of a broader agreement with Unilever's global food business. With Unilever shares currently showing heightened technical volatility and a prevailing bearish setup, investors should monitor for any sustained move outside the GBX4,719 to GBX4,923 range as a possible signal of trend resolution.





Latest Unilever News




-
 Afghanistan
-
 Albania
-
 Algeria
-
 Angola
-
 Argentina
-
 Armenia
-
 Australia
-
 Austria
-
 Azerbaijan
-
 Bahamas
-
 Bahrain
-
 Bangladesh
-
 Belarus
-
 Belgium
-
 Bolivia
-
 Botswana
-
 Brazil
-
 Brunei
-
 Bulgaria
-
 Cambodia
-
 Cameroon
-
 Canada
-
 Chile
-
 China
-
 Colombia
-
 Congo
-
 Costa Rica
-
 Cote d'Ivoire
-
 Croatia
-
 Cuba
-
 Cyprus
-
 Czechia
-
 DR Congo
-
 Denmark
-
 Dominican Republic
-
 Ecuador
-
 Egypt
-
 El Salvador
-
 Estonia
-
 Eswatini
-
 Ethiopia
-
 Finland
-
 France
-
 Georgia
-
 Germany
-
 Ghana
-
 Greece
-
 Haiti
-
 Hong Kong
-
 Hungary
-
 India
-
 Indonesia
-
 Iran, Islamic republic
-
 Iraq
-
 Ireland
-
 Israel
-
 Italy
-
 Jamaica
-
 Japan
-
 Jordan
-
 Kazakhstan
-
 Kenya
-
 Korea
-
 Kuwait
-
 Kyrgyzstan
-
 Laos
-
 Latvia
-
 Lebanon
-
 Lesotho
-
 Libya
-
 Lithuania
-
 Luxembourg
-
 Madagascar
-
 Malaysia
-
 Malta
-
 Mauritius
-
 Mexico
-
 Moldova
-
 Mongolia
-
 Montenegro
-
 Morocco
-
 Mozambique
-
 Myanmar
-
 Namibia
-
 Nepal
-
 Netherlands
-
 New Zealand
-
 Nigeria
-
 North Macedonia
-
 Norway
-
 Oman
-
 Pakistan
-
 Palestine
-
 Panama
-
 Papua New Guinea
-
 Paraguay
-
 Peru
-
 Philippines
-
 Poland
-
 Portugal
-
 Puerto Rico
-
 Qatar
-
 Reunion
-
 Romania
-
 Rwanda
-
 Saudi Arabia
-
 Serbia
-
 Singapore
-
 Slovakia
-
 Slovenia
-
 Somalia
-
 South Africa
-
 Spain
-
 Sri Lanka
-
 Sweden
-
 Switzerland
-
 Syria
-
 Taiwan
-
 Tajikistan
-
 Tanzania
-
 Thailand
-
 Trinidad and Tobago
-
 Tunisia
-
 Turkey
-
 UAE
-
 Uganda
-
 Ukraine
-
 United Kingdom
-
United States
-
 Uruguay
-
 Uzbekistan
-
 Venezuela
-
 Vietnam
-
 Yemen
-
 Zambia
-
 Zimbabwe
- Forex
- Crypto












