

Lockheed Martin stock forecast: Upward momentum likely to continue as bullish trend persists

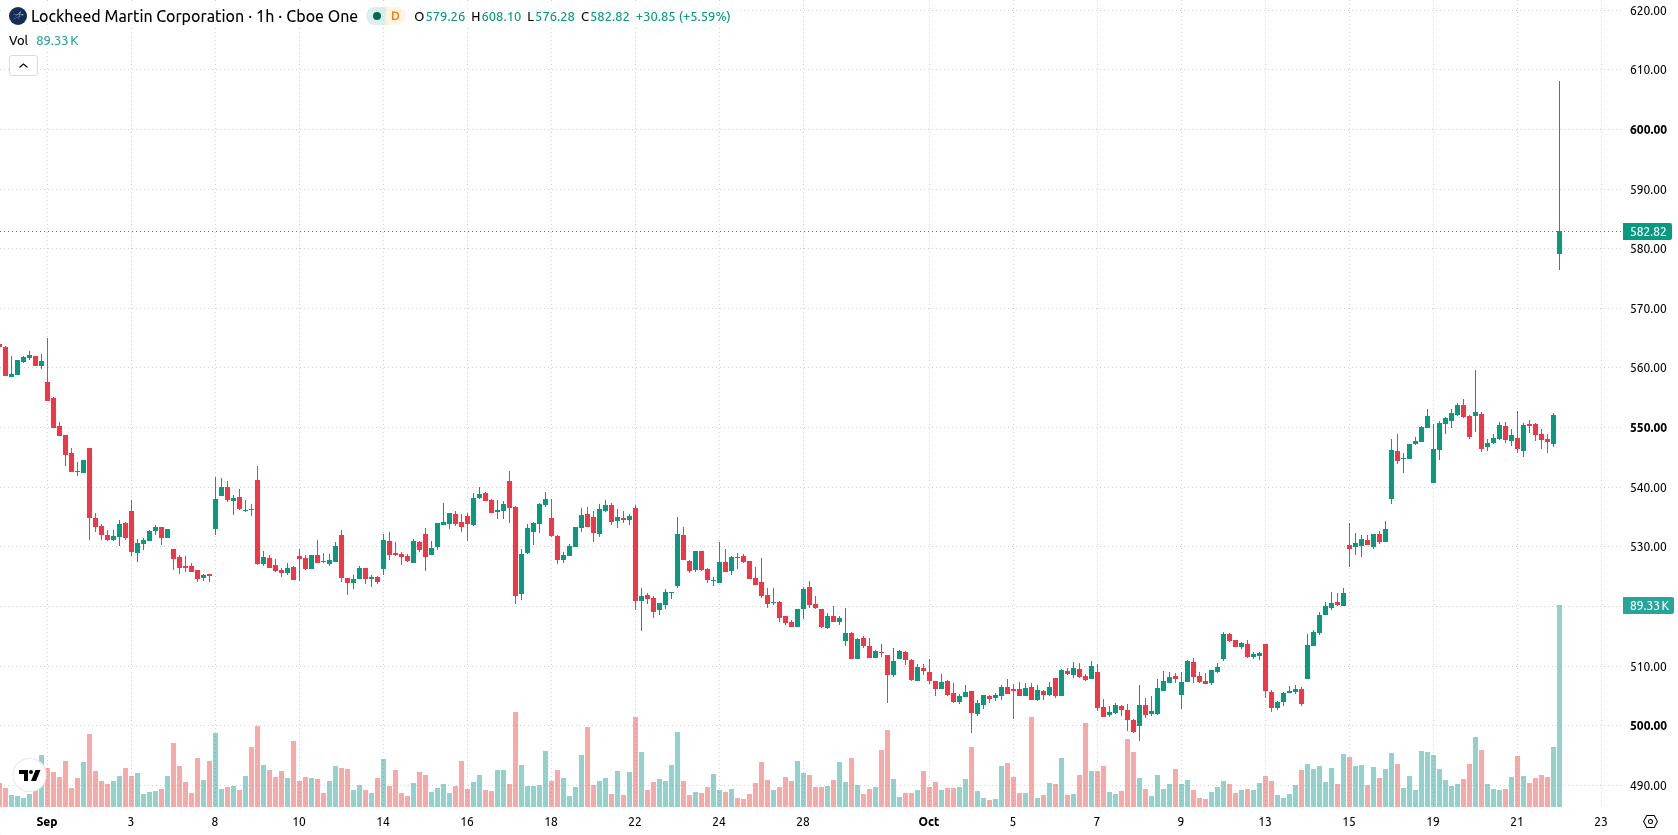
Lockheed Martin (LMT) stock is trading at $585, up 5.98% on the day and ending near its session high. The move places LMT comfortably above its key moving averages, reflecting strong short-term price momentum.
Highlights
- Lockheed Martin stock rose after reporting third-quarter 2026 earnings of $7.97 per share and $20.7 billion in revenue, both above expectations with revenue growing 11.3% year over year.
- The company increased its full-year outlook on strong defense demand, citing a record $292 billion backlog and securing new long-term F-35 agreements with the Department of War.
- Shares surged 5.98% to $585 on strong momentum and technical signals, with a 2 to 3 day forecast range of $549.36 to $594.71 and a high probability for further gains unless support at $550.16 breaks.
Earnings beat and F-35 deal amplify outlook and demand
Lockheed Martin delivered third-quarter 2026 earnings that beat analyst expectations, reporting $7.97 in earnings per share and $20.7 billion in revenue, an 11.3% year-over-year increase, which directly signals superior operating performance and lifts investor demand. The company has raised its full-year outlook, citing strong defense demand and a record $292 billion backlog, as reported by Gurufocus, reinforcing the perception of robust, long-term visibility. Additionally, the announcement of a new 10-year F-35 production agreement, together with a long-term framework deal with the Department of War to support the F-35 Lightning II program, further locks in high-value revenues and extends the growth trajectory. This combination of outperformance and strategic contract wins has created a powerful catalyst for the current upward move.
Mixed oscillator signals amid firm bullish momentum zone
Technically, LMT is trading above its MA-20 and MA-50 on the hourly chart, as well as above the daily MA-200, with the Ichimoku Kijun providing immediate support at $550.16. Positive momentum is confirmed by MACD in Strong Buy, ADX in Buy, and Stochastic RSI at Strong Buy levels, while RSI is at 60.97 (Buy). However, CCI remains Neutral and the Awesome Oscillator does not support the trend, indicating some underlying hesitation despite robust momentum elsewhere. Bull/Bear Power signals an overbought intraday condition, suggesting buyers are currently dominant.
Upward bias dominates as range-bound volatility narrows short-term risk
For the next 2 to 3 trading days, LMT is expected to trade within a volatility band between $549.36 and $594.71. The most probable scenario is continued upward movement, with only a minimal chance of a downside reversal. Should price action remain flat, consolidation is likely around current levels within the given range. A bullish breakout above resistance may drive LMT toward or above the range's upper limit, while a move below the $550.16 support could open the door to a deeper retracement.
In a recent review, analysts highlighted Lockheed Martin's constructive technical outlook supported by major defense contract wins and new product advancements. The current combination of earnings outperformance and fresh multi-year contracts further strengthens this bullish framework, with price action warranting close monitoring for a potential breakout above the $594.71 upper volatility band in the near term.






Latest Lockheed Martin News




-
 Afghanistan
-
 Albania
-
 Algeria
-
 Angola
-
 Argentina
-
 Armenia
-
 Australia
-
 Austria
-
 Azerbaijan
-
 Bahamas
-
 Bahrain
-
 Bangladesh
-
 Belarus
-
 Belgium
-
 Bolivia
-
 Botswana
-
 Brazil
-
 Brunei
-
 Bulgaria
-
 Cambodia
-
 Cameroon
-
 Canada
-
 Chile
-
 China
-
 Colombia
-
 Congo
-
 Costa Rica
-
 Cote d'Ivoire
-
 Croatia
-
 Cuba
-
 Cyprus
-
 Czechia
-
 DR Congo
-
 Denmark
-
 Dominican Republic
-
 Ecuador
-
 Egypt
-
 El Salvador
-
 Estonia
-
 Eswatini
-
 Ethiopia
-
 Finland
-
 France
-
 Georgia
-
 Germany
-
 Ghana
-
 Greece
-
 Haiti
-
 Hong Kong
-
 Hungary
-
 India
-
 Indonesia
-
 Iran, Islamic republic
-
 Iraq
-
 Ireland
-
 Israel
-
 Italy
-
 Jamaica
-
 Japan
-
 Jordan
-
 Kazakhstan
-
 Kenya
-
 Korea
-
 Kuwait
-
 Kyrgyzstan
-
 Laos
-
 Latvia
-
 Lebanon
-
 Lesotho
-
 Libya
-
 Lithuania
-
 Luxembourg
-
 Madagascar
-
 Malaysia
-
 Malta
-
 Mauritius
-
 Mexico
-
 Moldova
-
 Mongolia
-
 Montenegro
-
 Morocco
-
 Mozambique
-
 Myanmar
-
 Namibia
-
 Nepal
-
 Netherlands
-
 New Zealand
-
 Nigeria
-
 North Macedonia
-
 Norway
-
 Oman
-
 Pakistan
-
 Palestine
-
 Panama
-
 Papua New Guinea
-
 Paraguay
-
 Peru
-
 Philippines
-
 Poland
-
 Portugal
-
 Puerto Rico
-
 Qatar
-
 Reunion
-
 Romania
-
 Rwanda
-
 Saudi Arabia
-
 Serbia
-
 Singapore
-
 Slovakia
-
 Slovenia
-
 Somalia
-
 South Africa
-
 Spain
-
 Sri Lanka
-
 Sweden
-
 Switzerland
-
 Syria
-
 Taiwan
-
 Tajikistan
-
 Tanzania
-
 Thailand
-
 Trinidad and Tobago
-
 Tunisia
-
 Turkey
-
 UAE
-
 Uganda
-
 Ukraine
-
 United Kingdom
-
United States
-
 Uruguay
-
 Uzbekistan
-
 Venezuela
-
 Vietnam
-
 Yemen
-
 Zambia
-
 Zimbabwe
- Forex
- Crypto












