

Comcast shares technical analysis: Upward price move confirmed by buyer support

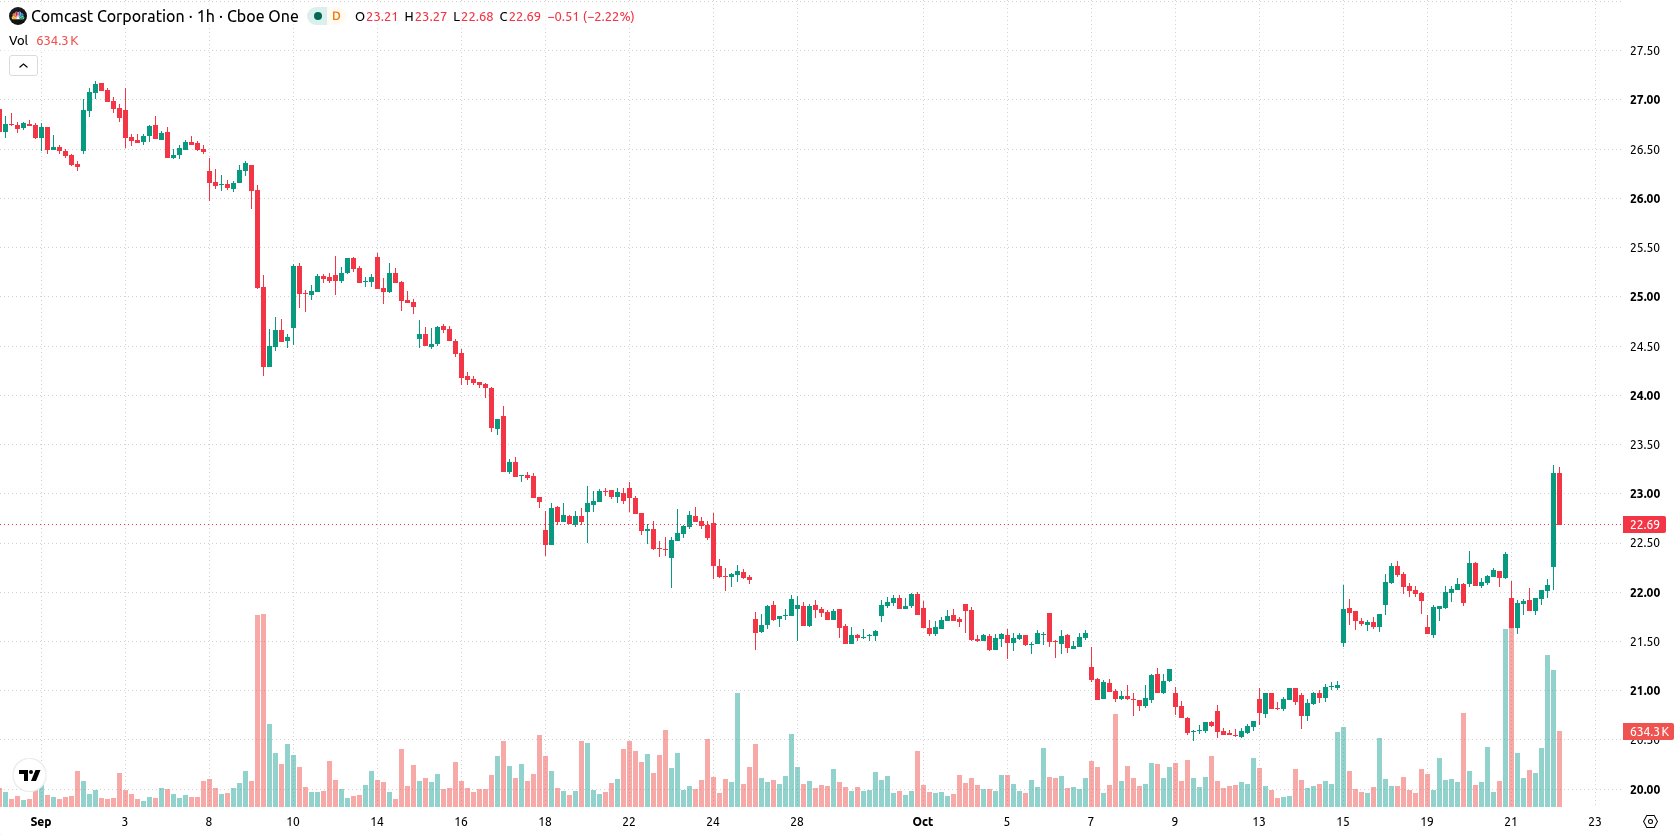
Comcast (CMCSA) stock is trading at $22.78, up 3.17% for the day. The price sits above its key moving averages, reflecting strong short-term momentum relative to recent trend benchmarks.
 23.28
23.28
Highlights
- Shares of Comcast rose after third-quarter adjusted earnings per share reached $1.07, surpassing analyst forecasts on revenue of $29.3 billion.
- Comcast declared a quarterly cash dividend of $0.33 per share and is pursuing a planned NBCUniversal spinoff alongside division restructuring and a Q3 profit at Peacock.
- Comcast stock surged 3.17% and short-term buyer momentum remains strong, but widespread overbought signals indicate risk of near-term consolidation between $22.38 and $23.17.
Earnings beat and strategic initiatives drive increased buying interest
Comcast’s third-quarter 2026 earnings exceeded expectations, with adjusted earnings per share of $1.07 surpassing analyst estimates and revenue of $29.3 billion meeting consensus, according to Yahoo Finance and Gurufocus. This strong operational performance acts as the central driver for today's buying interest. Additional support comes from the recently declared quarterly cash dividend of $0.33 per share, as reported by TradingView, and ongoing strategic steps like the planned spinoff of NBCUniversal, which could unlock further shareholder value. Positive segment performance from Peacock, which achieved a $261 million profit in Q3, along with the announced restructuring plans for the broadband and video divisions to address ongoing customer losses, rounds out the current news background.
Intraday strength as technicals signal buyer control and overbought risk
CMCSA/USD is currently trading above the MA-20 at $22.06 and the MA-50 at $21.68 on the hourly chart, while it remains below the MA-200 at $26.28. Immediate support is provided by the Ichimoku Kijun at $22.12. Momentum indicators stay robust, as both MACD and ADX remain in buy mode. RSI holds at a bullish 65.61, while Stochastic RSI, CCI, and Bull/Bear Power are registering overbought conditions and indicate strong dominance by buyers during the session. The Awesome Oscillator continues to show a firm buy signal. The surge in price and closing near the session’s high confirms positive intraday momentum, though the cluster of overbought signals flags the potential for a short-term pullback or sideways consolidation.
Upside favored as narrow trading range and breakout risks converge
For the next two to three trading days, CMCSA is expected to move within the $22.38 to $23.17 range, with a 79% probability of further upside and just a 21% risk of decline. The baseline scenario suggests CMCSA will remain in a narrow sideways band based on typical volatility. A sustained break above resistance could trigger fresh upside momentum, while a drop through immediate support risks further losses.
Previously it was reported that Comcast’s third quarter 2026 results shifted the technical outlook to a more cautious, downside-favored stance. The current price breakout above key moving averages, coupled with robust earnings and operational developments, signals a potential change in trend direction and sets the $23.17 resistance as an important level for traders to monitor in the coming sessions.









-
 Afghanistan
-
 Albania
-
 Algeria
-
 Angola
-
 Argentina
-
 Armenia
-
 Australia
-
 Austria
-
 Azerbaijan
-
 Bahamas
-
 Bahrain
-
 Bangladesh
-
 Belarus
-
 Belgium
-
 Bolivia
-
 Botswana
-
 Brazil
-
 Brunei
-
 Bulgaria
-
 Cambodia
-
 Cameroon
-
 Canada
-
 Chile
-
 China
-
 Colombia
-
 Congo
-
 Costa Rica
-
 Cote d'Ivoire
-
 Croatia
-
 Cuba
-
 Cyprus
-
 Czechia
-
 DR Congo
-
 Denmark
-
 Dominican Republic
-
 Ecuador
-
 Egypt
-
 El Salvador
-
 Estonia
-
 Eswatini
-
 Ethiopia
-
 Finland
-
 France
-
 Georgia
-
 Germany
-
 Ghana
-
 Greece
-
 Haiti
-
 Hong Kong
-
 Hungary
-
 India
-
 Indonesia
-
 Iran, Islamic republic
-
 Iraq
-
 Ireland
-
 Israel
-
 Italy
-
 Jamaica
-
 Japan
-
 Jordan
-
 Kazakhstan
-
 Kenya
-
 Korea
-
 Kuwait
-
 Kyrgyzstan
-
 Laos
-
 Latvia
-
 Lebanon
-
 Lesotho
-
 Libya
-
 Lithuania
-
 Luxembourg
-
 Madagascar
-
 Malaysia
-
 Malta
-
 Mauritius
-
 Mexico
-
 Moldova
-
 Mongolia
-
 Montenegro
-
 Morocco
-
 Mozambique
-
 Myanmar
-
 Namibia
-
 Nepal
-
 Netherlands
-
 New Zealand
-
 Nigeria
-
 North Macedonia
-
 Norway
-
 Oman
-
 Pakistan
-
 Palestine
-
 Panama
-
 Papua New Guinea
-
 Paraguay
-
 Peru
-
 Philippines
-
 Poland
-
 Portugal
-
 Puerto Rico
-
 Qatar
-
 Reunion
-
 Romania
-
 Rwanda
-
 Saudi Arabia
-
 Serbia
-
 Singapore
-
 Slovakia
-
 Slovenia
-
 Somalia
-
 South Africa
-
 Spain
-
 Sri Lanka
-
 Sweden
-
 Switzerland
-
 Syria
-
 Taiwan
-
 Tajikistan
-
 Tanzania
-
 Thailand
-
 Trinidad and Tobago
-
 Tunisia
-
 Turkey
-
 UAE
-
 Uganda
-
 Ukraine
-
 United Kingdom
-
United States
-
 Uruguay
-
 Uzbekistan
-
 Venezuela
-
 Vietnam
-
 Yemen
-
 Zambia
-
 Zimbabwe
- Forex
- Crypto












