

SLB shares technical analysis: Downward price move and overbought conditions limit recovery prospects

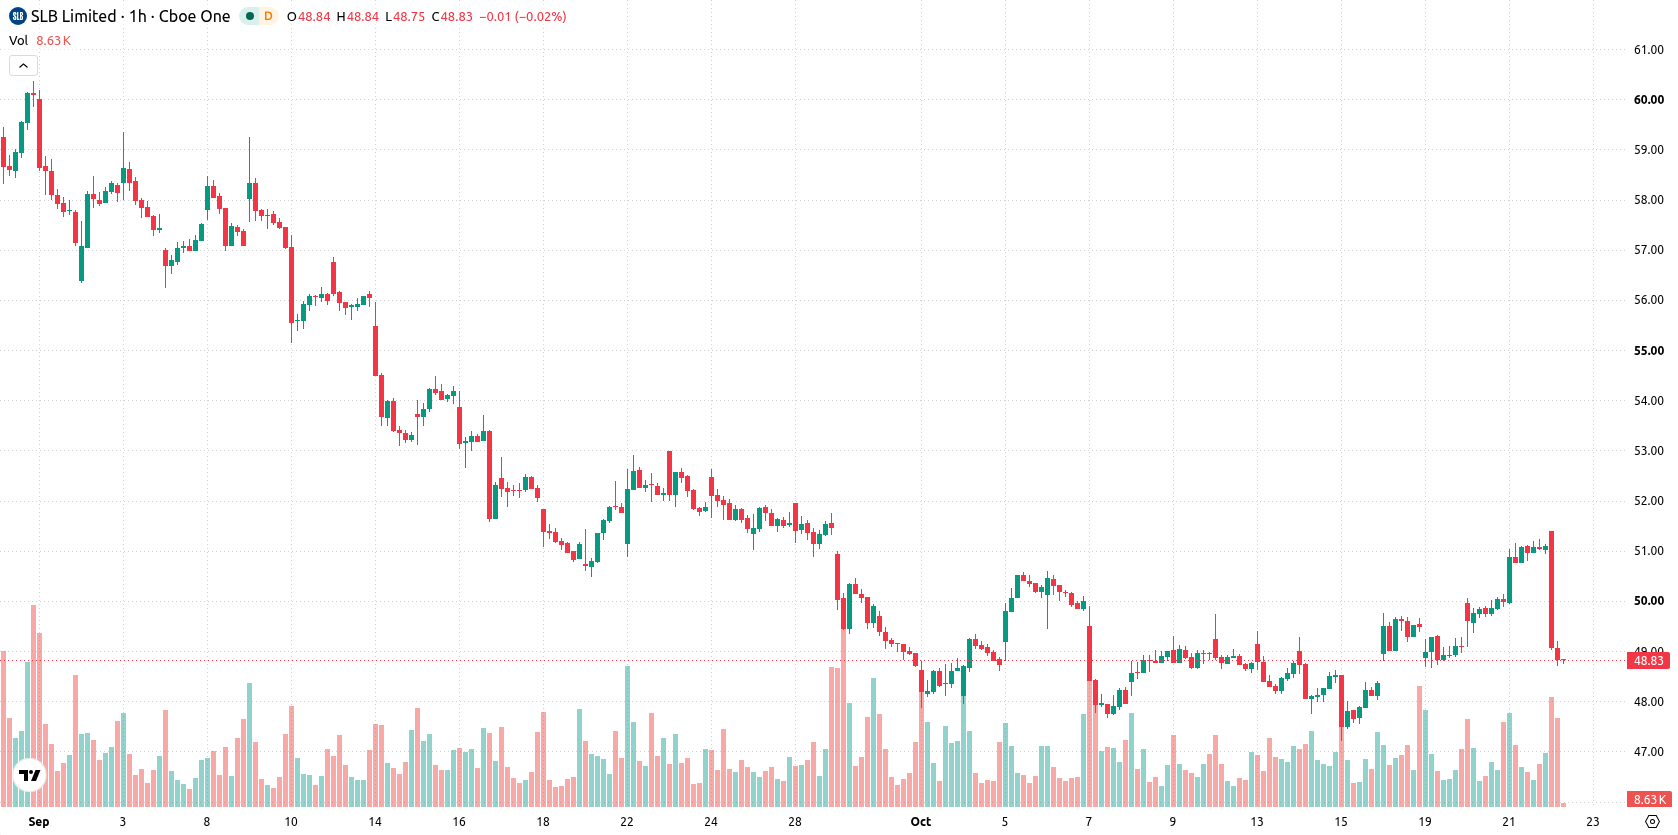
SLB (SLB) stock is trading at $48.93, down 4.25% on the day and closing near the session’s low. The price is currently positioned below its key moving averages, reflecting continued short-term and longer-term weakness.
 50.20
52.68
Highlights
- SLB will release Q3 2026 earnings on October 23 before market open, introducing near-term uncertainty for investors.
- Shares of SLB have faced ongoing selling pressure leading up to the scheduled report, anticipating elevated volatility.
- SLB stock trades below key moving averages with mixed momentum signals, an expected range of $47.18 to $50.07, and a 76% probability of further downside.
Earnings release spurs caution as volatility risk builds
SLB is set to release its Q3 2026 earnings results on Friday, October 23, before the market opens, according to Seeking Alpha. The approaching report introduces near-term uncertainty as investors prepare for new financial disclosures, often prompting portfolio adjustments and cautious positioning. While this scheduled event is expected to drive volatility, price action has remained under broader selling pressure.
Divergent momentum as technical barriers stall rebound
SLB is currently trading below the MA-20 at $50 and the MA-50 at $49.15 on the hourly chart, with additional weakness visible as the price also trades below the MA-200 at $51.17 on the daily timeframe. The Ichimoku Kijun at $49.96 acts as immediate resistance to any rebound. Momentum indicators are mixed: both MACD and ADX show buy signals, while RSI is elevated at 71.27, and Stoch RSI, CCI, and Bull/Bear Power all signal an overbought or strong buyer dominance. The Awesome Oscillator remains neutral, indicating no confirmation of either direction and highlighting a divergence between intraday momentum and overheated oscillator readings.
Downside favored unless support breaks amid choppy range
In the short term, SLB is expected to trade within a range of $47.18 to $50.07, reflecting typical volatility bands relative to current levels. The baseline scenario anticipates sideways movement between these support and resistance levels. If the price breaks decisively above $49.96, a short-term recovery may unfold, while a move below $47.18 would confirm the prevailing downtrend and expose the stock to further declines. Probability estimates suggest a 76% chance of further downside and a 24% chance of a rebound over the next 2–3 trading days.
Earlier, analysts noted that SLB remained under broad-based selling pressure despite positive earnings surprises and governance changes. The current technical setup reinforces this negative outlook, with downside risk heightened ahead of the upcoming earnings report as traders should closely monitor for a decisive move below $47.18 to signal further weakness.










-
 Afghanistan
-
 Albania
-
 Algeria
-
 Angola
-
 Argentina
-
 Armenia
-
 Australia
-
 Austria
-
 Azerbaijan
-
 Bahamas
-
 Bahrain
-
 Bangladesh
-
 Belarus
-
 Belgium
-
 Bolivia
-
 Botswana
-
 Brazil
-
 Brunei
-
 Bulgaria
-
 Cambodia
-
 Cameroon
-
 Canada
-
 Chile
-
 China
-
 Colombia
-
 Congo
-
 Costa Rica
-
 Cote d'Ivoire
-
 Croatia
-
 Cuba
-
 Cyprus
-
 Czechia
-
 DR Congo
-
 Denmark
-
 Dominican Republic
-
 Ecuador
-
 Egypt
-
 El Salvador
-
 Estonia
-
 Eswatini
-
 Ethiopia
-
 Finland
-
 France
-
 Georgia
-
 Germany
-
 Ghana
-
 Greece
-
 Haiti
-
 Hong Kong
-
 Hungary
-
 India
-
 Indonesia
-
 Iran, Islamic republic
-
 Iraq
-
 Ireland
-
 Israel
-
 Italy
-
 Jamaica
-
 Japan
-
 Jordan
-
 Kazakhstan
-
 Kenya
-
 Korea
-
 Kuwait
-
 Kyrgyzstan
-
 Laos
-
 Latvia
-
 Lebanon
-
 Lesotho
-
 Libya
-
 Lithuania
-
 Luxembourg
-
 Madagascar
-
 Malaysia
-
 Malta
-
 Mauritius
-
 Mexico
-
 Moldova
-
 Mongolia
-
 Montenegro
-
 Morocco
-
 Mozambique
-
 Myanmar
-
 Namibia
-
 Nepal
-
 Netherlands
-
 New Zealand
-
 Nigeria
-
 North Macedonia
-
 Norway
-
 Oman
-
 Pakistan
-
 Palestine
-
 Panama
-
 Papua New Guinea
-
 Paraguay
-
 Peru
-
 Philippines
-
 Poland
-
 Portugal
-
 Puerto Rico
-
 Qatar
-
 Reunion
-
 Romania
-
 Rwanda
-
 Saudi Arabia
-
 Serbia
-
 Singapore
-
 Slovakia
-
 Slovenia
-
 Somalia
-
 South Africa
-
 Spain
-
 Sri Lanka
-
 Sweden
-
 Switzerland
-
 Syria
-
 Taiwan
-
 Tajikistan
-
 Tanzania
-
 Thailand
-
 Trinidad and Tobago
-
 Tunisia
-
 Turkey
-
 UAE
-
 Uganda
-
 Ukraine
-
 United Kingdom
-
United States
-
 Uruguay
-
 Uzbekistan
-
 Venezuela
-
 Vietnam
-
 Yemen
-
 Zambia
-
 Zimbabwe
- Forex
- Crypto












