


SLB (SLB) stock is trading at $50.15, down 2.99% for the day. The price currently sits below its key short- and long-term moving averages, indicating prevailing downside momentum.
 50.59
51.69
Highlights
- SLB repurchased $656 million of its shares, reducing float and mechanically supporting per-share figures.
- SLB reached a deal to acquire Kelvion and received board approval for an upcoming dividend, yet shares remain under selling pressure.
- Shares of SLB trade below key moving averages and face persistent bearish momentum, with a forecast range of $48.76 to $51.54.
Share buybacks and acquisition plans offer limited short-term support
SLB has repurchased $656 million of its own shares, an action that reduces the outstanding float and mechanically supports per-share metrics, according to Yahoo Finance. Such buybacks can offer short-term price support, though prevailing market conditions may limit their immediate impact. Additional announcements include an agreement to acquire Kelvion and board approval for an upcoming dividend, though price action has remained under broader selling pressure.
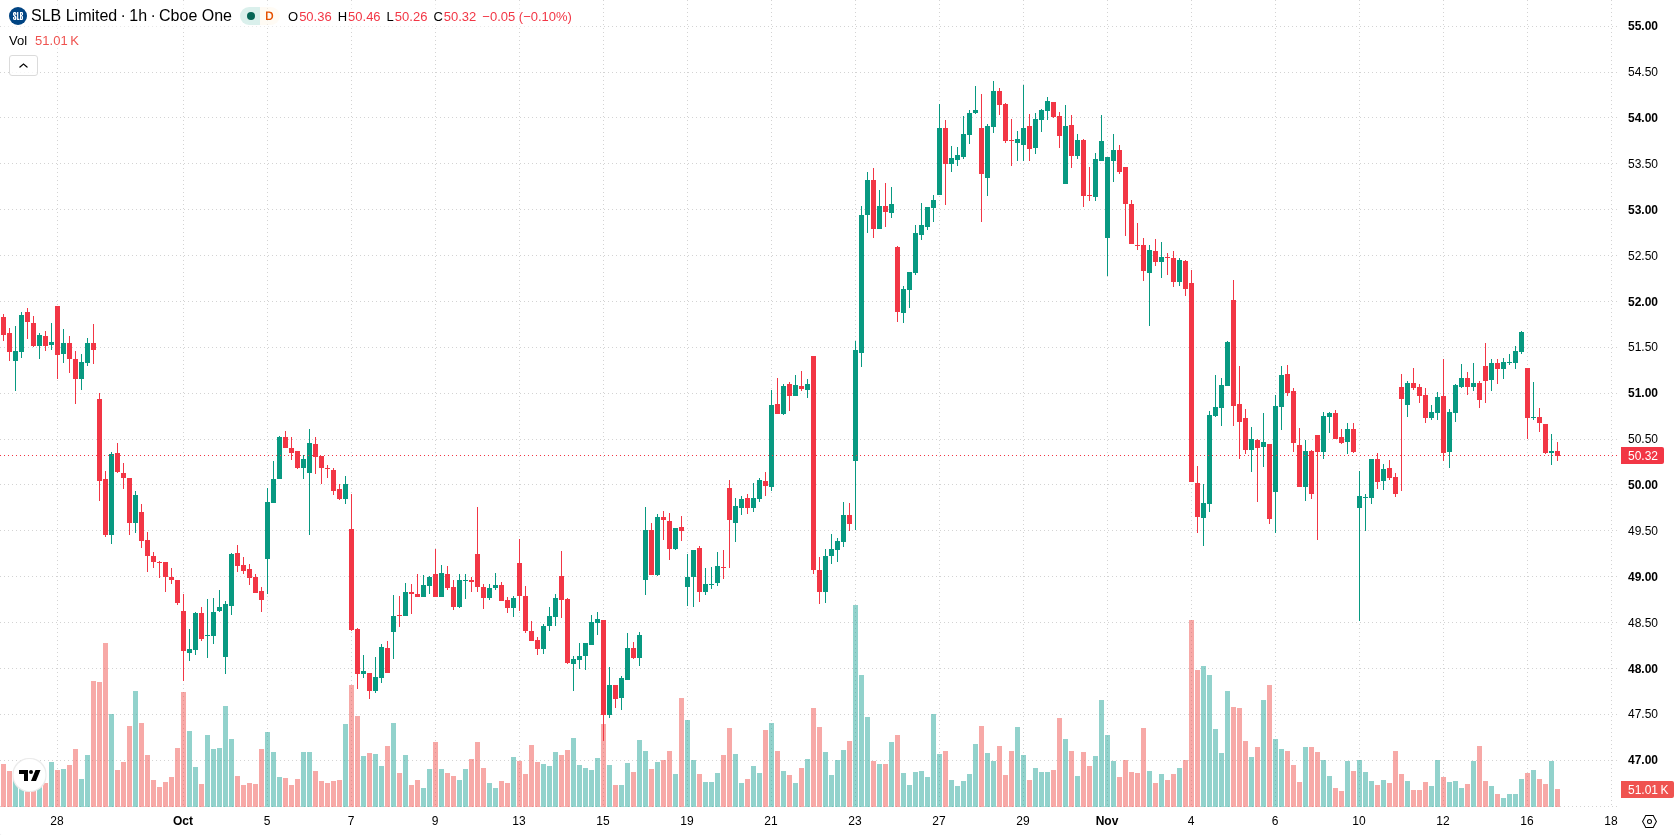
Neutral indicators and nearby resistance cap weak rebound potential
On the technical front, SLB is currently trading below H1 SMA-20 at $51.08, H1 SMA-50 at $50.69, and D1 SMA-200 at $51.59. The Ichimoku Kijun on the daily timeframe presents immediate resistance at $50.78, just above the last traded price. MACD signals a possible buy, while ADX, RSI, and CCI all remain neutral, reflecting a lack of decisive momentum. Stoch RSI is in the oversold zone, suggesting room for a potential short-term rebound, and Bull/Bear Power stands marginally positive at 0.01, showing very slight buyer presence intraday.
Sideways trend likely as downside risk outweighs bullish prospects
In the near term, SLB is expected to trade within a volatility band between $48.76 and $51.54. There is a 21% probability of an upward move, while downside movement is estimated at 79%. The baseline scenario points to continued sideways fluctuations unless price action breaks above immediate resistance, which could trigger a bullish case, or slips below support, which would reinforce further declines.
Previously it was reported that SLB was experiencing persistent downside pressure according to technical indicators, with limited prospects for an immediate rebound. The latest developments—including substantial share buybacks, new acquisitions, and a refreshed indicator mix—add nuance to the outlook, but continued technical weakness suggests traders should closely monitor the $50.78 resistance level for signs of a directional shift.






Latest Schlumberger News




-
 Afghanistan
-
 Albania
-
 Algeria
-
 Angola
-
 Argentina
-
 Armenia
-
 Australia
-
 Austria
-
 Azerbaijan
-
 Bahamas
-
 Bahrain
-
 Bangladesh
-
 Belarus
-
 Belgium
-
 Bolivia
-
 Botswana
-
 Brazil
-
 Brunei
-
 Bulgaria
-
 Cambodia
-
 Cameroon
-
 Canada
-
 Chile
-
 China
-
 Colombia
-
 Congo
-
 Costa Rica
-
 Cote d'Ivoire
-
 Croatia
-
 Cuba
-
 Cyprus
-
 Czechia
-
 DR Congo
-
 Denmark
-
 Dominican Republic
-
 Ecuador
-
 Egypt
-
 El Salvador
-
 Estonia
-
 Eswatini
-
 Ethiopia
-
 Finland
-
 France
-
 Georgia
-
 Germany
-
 Ghana
-
 Greece
-
 Haiti
-
 Hong Kong
-
 Hungary
-
 India
-
 Indonesia
-
 Iran, Islamic republic
-
 Iraq
-
 Ireland
-
 Israel
-
 Italy
-
 Jamaica
-
 Japan
-
 Jordan
-
 Kazakhstan
-
 Kenya
-
 Korea
-
 Kuwait
-
 Kyrgyzstan
-
 Laos
-
 Latvia
-
 Lebanon
-
 Lesotho
-
 Libya
-
 Lithuania
-
 Luxembourg
-
 Madagascar
-
 Malaysia
-
 Malta
-
 Mauritius
-
 Mexico
-
 Moldova
-
 Mongolia
-
 Montenegro
-
 Morocco
-
 Mozambique
-
 Myanmar
-
 Namibia
-
 Nepal
-
 Netherlands
-
 New Zealand
-
 Nigeria
-
 North Macedonia
-
 Norway
-
 Oman
-
 Pakistan
-
 Palestine
-
 Panama
-
 Papua New Guinea
-
 Paraguay
-
 Peru
-
 Philippines
-
 Poland
-
 Portugal
-
 Puerto Rico
-
 Qatar
-
 Reunion
-
 Romania
-
 Rwanda
-
 Saudi Arabia
-
 Serbia
-
 Singapore
-
 Slovakia
-
 Slovenia
-
 Somalia
-
 South Africa
-
 Spain
-
 Sri Lanka
-
 Sweden
-
 Switzerland
-
 Syria
-
 Taiwan
-
 Tajikistan
-
 Tanzania
-
 Thailand
-
 Trinidad and Tobago
-
 Tunisia
-
 Turkey
-
 UAE
-
 Uganda
-
 Ukraine
-
 United Kingdom
-
United States
-
 Uruguay
-
 Uzbekistan
-
 Venezuela
-
 Vietnam
-
 Yemen
-
 Zambia
-
 Zimbabwe
- Forex
- Crypto












