

Will SLB stock break resistance amid strong earnings growth and Middle East sales surge?

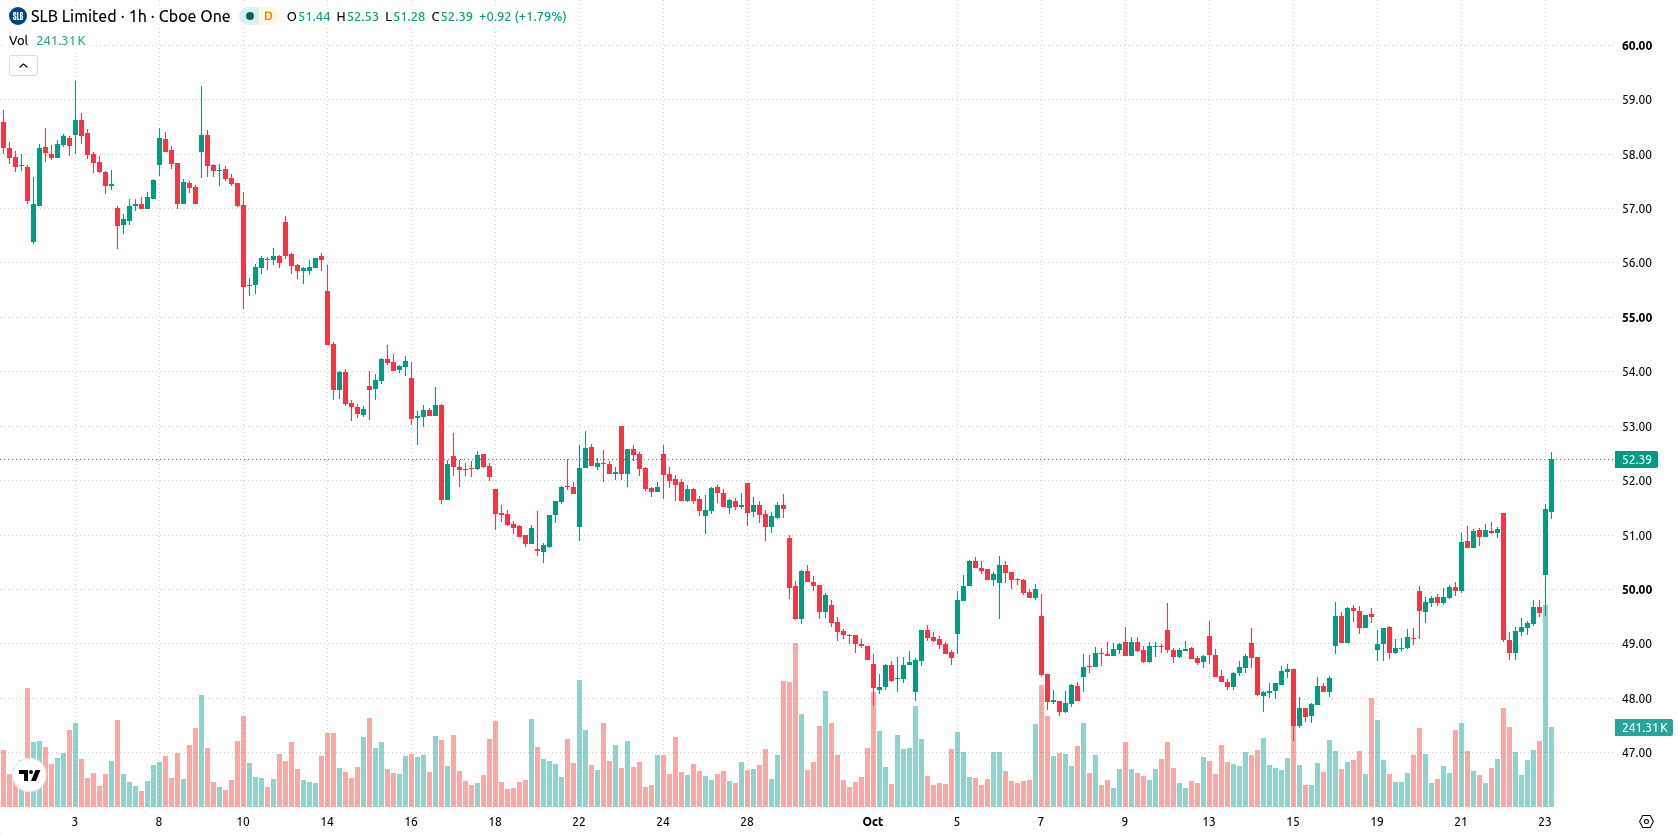
SLB (SLB) stock is trading at $52.16, up 5.2% for the day. The price remains firmly above its key moving averages, reflecting a strong short-term and long-term technical profile.
 53.81
54.36
Highlights
- SLB reported third-quarter revenue of $9.45 billion, achieving a 13% sequential revenue increase in the Middle East.
- The ChampionX acquisition produced record revenue and successful integration, supporting SLB's move into higher-growth business lines.
- Shares of SLB trade above key moving averages with a bullish price setup, expected to consolidate between $49.57 and $53.3 in the near term.
Earnings beat and Middle East gains drive acquisition-fueled rally
SLB Ltd reported third-quarter revenue of $9.45 billion, outpacing recent quarters and highlighting a 13% sequential rise in the Middle East, according to Gurufocus. The record revenue contribution from the ChampionX acquisition demonstrates successful integration and strategic expansion into higher-growth segments. Strong earnings growth and enhanced geographic performance from newly acquired assets have triggered greater demand for the stock, supporting the current upward move.
Divergent momentum and trend signals create reversal risk
SLB is trading above the hourly MA-20 at $50.06, the MA-50 at $49.26, and also the long-term MA-200 at $51.2. The Ichimoku Kijun level at $50.05 provides immediate support. Currently, momentum indicators present a mixed picture: MACD and Awesome Oscillator are neutral, while ADX, RSI at 47.76, Bull/Bear Power, and CCI are signaling sells. Stochastic RSI remains neutral. This configuration indicates sellers dominate intraday action, with negative readings from RSI, CCI, and Bull/Bear Power contrasting a recent volatile price surge. The divergence between price momentum and oscillator signals reflects short-term uncertainty and potential for reversal.
Consolidation favored as probability skews toward further gains
For the near term, SLB is expected to trade within a range of $49.57 to $53.3, representing the typical volatility band relative to current levels. Based on current technical and news factors, there is a 71% probability of gains versus a 29% likelihood of a downside move. The baseline scenario favors consolidation within this range; a break above $53.3 could open the way for further upside, while a drop under $49.57 would expose the price to additional selling pressure.
In a recent review, analysts noted that SLB's improved financial performance and expanding presence in key international markets positioned the company for a strong but potentially volatile rebound into 2027. Building on this, current technicals and robust integration of recent acquisitions reinforce a consolidation scenario with the $49.57 to $53.3 range representing a key zone for traders to monitor for potential breakout or breakdown moves.






Latest Schlumberger News




-
 Afghanistan
-
 Albania
-
 Algeria
-
 Angola
-
 Argentina
-
 Armenia
-
 Australia
-
 Austria
-
 Azerbaijan
-
 Bahamas
-
 Bahrain
-
 Bangladesh
-
 Belarus
-
 Belgium
-
 Bolivia
-
 Botswana
-
 Brazil
-
 Brunei
-
 Bulgaria
-
 Cambodia
-
 Cameroon
-
 Canada
-
 Chile
-
 China
-
 Colombia
-
 Congo
-
 Costa Rica
-
 Cote d'Ivoire
-
 Croatia
-
 Cuba
-
 Cyprus
-
 Czechia
-
 DR Congo
-
 Denmark
-
 Dominican Republic
-
 Ecuador
-
 Egypt
-
 El Salvador
-
 Estonia
-
 Eswatini
-
 Ethiopia
-
 Finland
-
 France
-
 Georgia
-
 Germany
-
 Ghana
-
 Greece
-
 Haiti
-
 Hong Kong
-
 Hungary
-
 India
-
 Indonesia
-
 Iran, Islamic republic
-
 Iraq
-
 Ireland
-
 Israel
-
 Italy
-
 Jamaica
-
 Japan
-
 Jordan
-
 Kazakhstan
-
 Kenya
-
 Korea
-
 Kuwait
-
 Kyrgyzstan
-
 Laos
-
 Latvia
-
 Lebanon
-
 Lesotho
-
 Libya
-
 Lithuania
-
 Luxembourg
-
 Madagascar
-
 Malaysia
-
 Malta
-
 Mauritius
-
 Mexico
-
 Moldova
-
 Mongolia
-
 Montenegro
-
 Morocco
-
 Mozambique
-
 Myanmar
-
 Namibia
-
 Nepal
-
 Netherlands
-
 New Zealand
-
 Nigeria
-
 North Macedonia
-
 Norway
-
 Oman
-
 Pakistan
-
 Palestine
-
 Panama
-
 Papua New Guinea
-
 Paraguay
-
 Peru
-
 Philippines
-
 Poland
-
 Portugal
-
 Puerto Rico
-
 Qatar
-
 Reunion
-
 Romania
-
 Rwanda
-
 Saudi Arabia
-
 Serbia
-
 Singapore
-
 Slovakia
-
 Slovenia
-
 Somalia
-
 South Africa
-
 Spain
-
 Sri Lanka
-
 Sweden
-
 Switzerland
-
 Syria
-
 Taiwan
-
 Tajikistan
-
 Tanzania
-
 Thailand
-
 Trinidad and Tobago
-
 Tunisia
-
 Turkey
-
 UAE
-
 Uganda
-
 Ukraine
-
 United Kingdom
-
United States
-
 Uruguay
-
 Uzbekistan
-
 Venezuela
-
 Vietnam
-
 Yemen
-
 Zambia
-
 Zimbabwe
- Forex
- Crypto












