

SLB stock falls amid persistent seller pressure and weak momentum signals

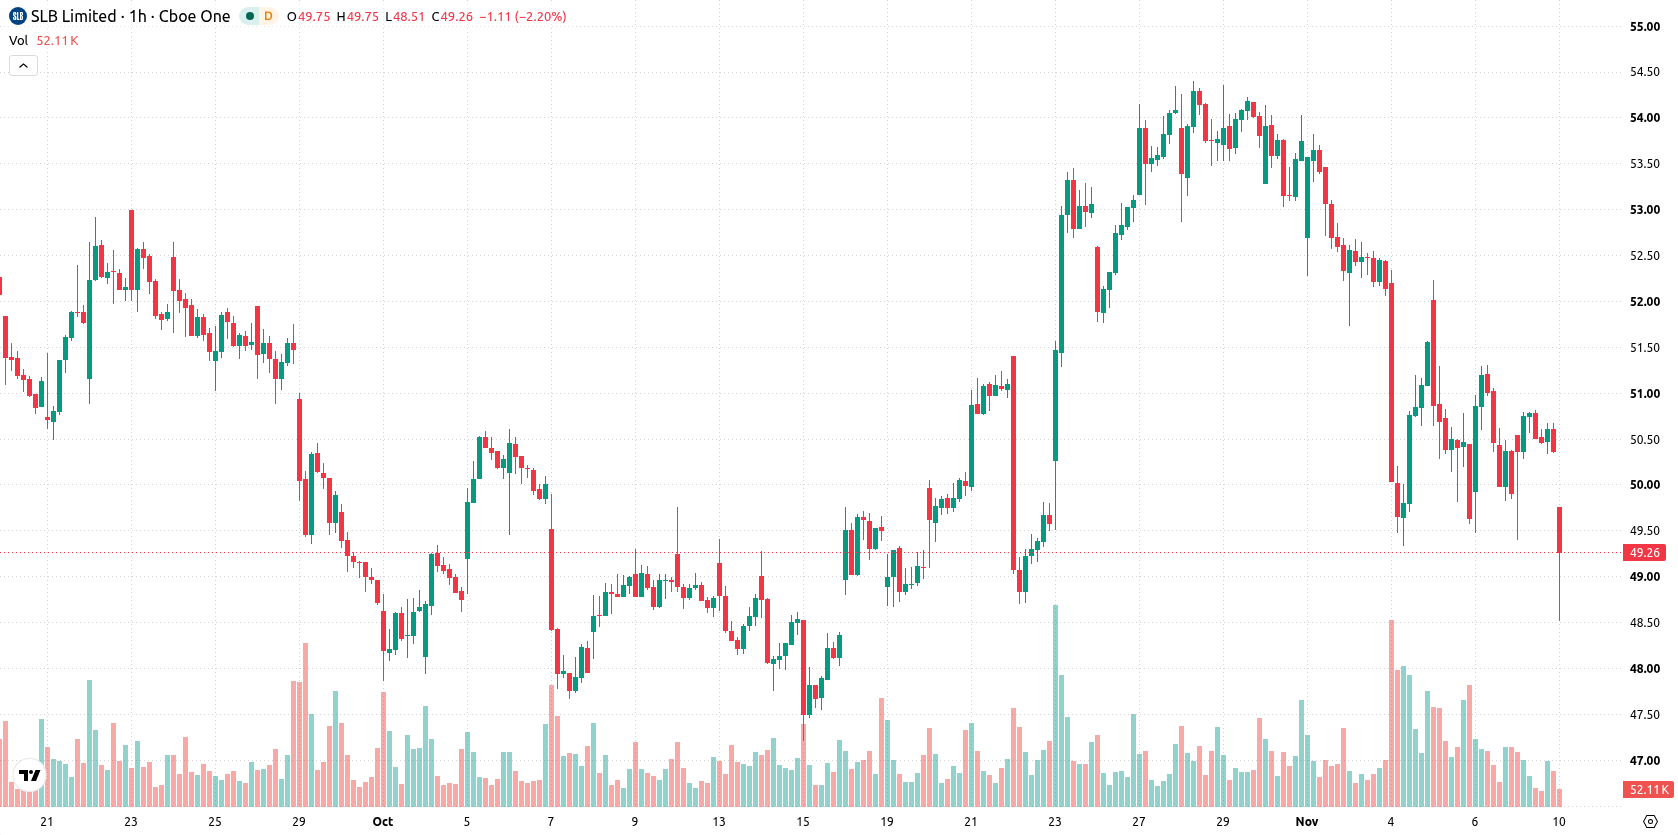
SLB (SLB) stock is trading at $49.16 after a decline of 2.41% today. The price is currently positioned below its key moving averages, highlighting short-term weakness.
 50.01
52.51
Highlights
- Allspring Global Investments Holdings LLC increased its position in SLB Limited by 33.1% during the third quarter, acquiring 383,301 shares for a total of 1,542,043.
- Recent institutional buying may indicate long-term positive expectations, but filings reflect actions from the prior quarter rather than current price movement.
- Shares of SLB trade below key moving averages with strong bearish momentum, and the price is projected to fluctuate between $47.76 and $50.67 in the coming days.
Institutional buying adds liquidity despite ongoing price losses
Allspring Global Investments Holdings LLC increased its position in SLB Limited by 33.1% during the third quarter, purchasing an additional 383,301 shares for a total of 1,542,043, as reported in the latest Securities and Exchange Commission filing according to Defenseworld. Such moves by institutional investors introduce fresh liquidity to the market and may be interpreted as a signal of confidence in the company's long-term prospects. However, these filings reflect actions during the recent quarter and may not directly counteract current downward price momentum.
Multiple technical signals confirm downside momentum and neutral indicators
Technically, SLB is trading below its MA-20, MA-50, and MA-200 levels, all indicating persistent downside pressure across multiple timeframes. The Ichimoku Kijun at $50.92 functions as immediate resistance. On the indicator front, MACD and ADX are both generating strong sell signals, while RSI, Stoch RSI, and CCI remain neutral, showing neither overbought nor oversold conditions. Bull/Bear Power is slightly positive at 0.13, hinting at mild buyer presence intraday, though the Awesome Oscillator is neutral and does not confirm any short-term reversal. Volatility is moderate, with prices near the session low and a small gap down observed.
Downside risk prevails as support tested amid muted breakout odds
Over the next few days, the expected trading range for SLB is $47.76 to $50.67, which represents a typical volatility band relative to current levels. The probability of an upward breakout is very low, while further declines are much more likely unless support at $47.76 holds. If the price manages to surpass resistance at $50.92, a bullish scenario could emerge, but the baseline expectation is for continued fluctuations within the current range and a higher risk of downside if support is breached.
Earlier, analysts noted that SLB's improving financial performance and integration of acquisitions positioned the company for a period of consolidation with potential for further gains. The current technical weakness and increased downside risk represent a shift from that outlook, highlighting $47.76 as a crucial support level for traders to monitor in the coming sessions.










-
 Afghanistan
-
 Albania
-
 Algeria
-
 Angola
-
 Argentina
-
 Armenia
-
 Australia
-
 Austria
-
 Azerbaijan
-
 Bahamas
-
 Bahrain
-
 Bangladesh
-
 Belarus
-
 Belgium
-
 Bolivia
-
 Botswana
-
 Brazil
-
 Brunei
-
 Bulgaria
-
 Cambodia
-
 Cameroon
-
 Canada
-
 Chile
-
 China
-
 Colombia
-
 Congo
-
 Costa Rica
-
 Cote d'Ivoire
-
 Croatia
-
 Cuba
-
 Cyprus
-
 Czechia
-
 DR Congo
-
 Denmark
-
 Dominican Republic
-
 Ecuador
-
 Egypt
-
 El Salvador
-
 Estonia
-
 Eswatini
-
 Ethiopia
-
 Finland
-
 France
-
 Georgia
-
 Germany
-
 Ghana
-
 Greece
-
 Haiti
-
 Hong Kong
-
 Hungary
-
 India
-
 Indonesia
-
 Iran, Islamic republic
-
 Iraq
-
 Ireland
-
 Israel
-
 Italy
-
 Jamaica
-
 Japan
-
 Jordan
-
 Kazakhstan
-
 Kenya
-
 Korea
-
 Kuwait
-
 Kyrgyzstan
-
 Laos
-
 Latvia
-
 Lebanon
-
 Lesotho
-
 Libya
-
 Lithuania
-
 Luxembourg
-
 Madagascar
-
 Malaysia
-
 Malta
-
 Mauritius
-
 Mexico
-
 Moldova
-
 Mongolia
-
 Montenegro
-
 Morocco
-
 Mozambique
-
 Myanmar
-
 Namibia
-
 Nepal
-
 Netherlands
-
 New Zealand
-
 Nigeria
-
 North Macedonia
-
 Norway
-
 Oman
-
 Pakistan
-
 Palestine
-
 Panama
-
 Papua New Guinea
-
 Paraguay
-
 Peru
-
 Philippines
-
 Poland
-
 Portugal
-
 Puerto Rico
-
 Qatar
-
 Reunion
-
 Romania
-
 Rwanda
-
 Saudi Arabia
-
 Serbia
-
 Singapore
-
 Slovakia
-
 Slovenia
-
 Somalia
-
 South Africa
-
 Spain
-
 Sri Lanka
-
 Sweden
-
 Switzerland
-
 Syria
-
 Taiwan
-
 Tajikistan
-
 Tanzania
-
 Thailand
-
 Trinidad and Tobago
-
 Tunisia
-
 Turkey
-
 UAE
-
 Uganda
-
 Ukraine
-
 United Kingdom
-
United States
-
 Uruguay
-
 Uzbekistan
-
 Venezuela
-
 Vietnam
-
 Yemen
-
 Zambia
-
 Zimbabwe
- Forex
- Crypto












