

SLB Limited announces new Meta partnership: Can SLB sustain recent gains?

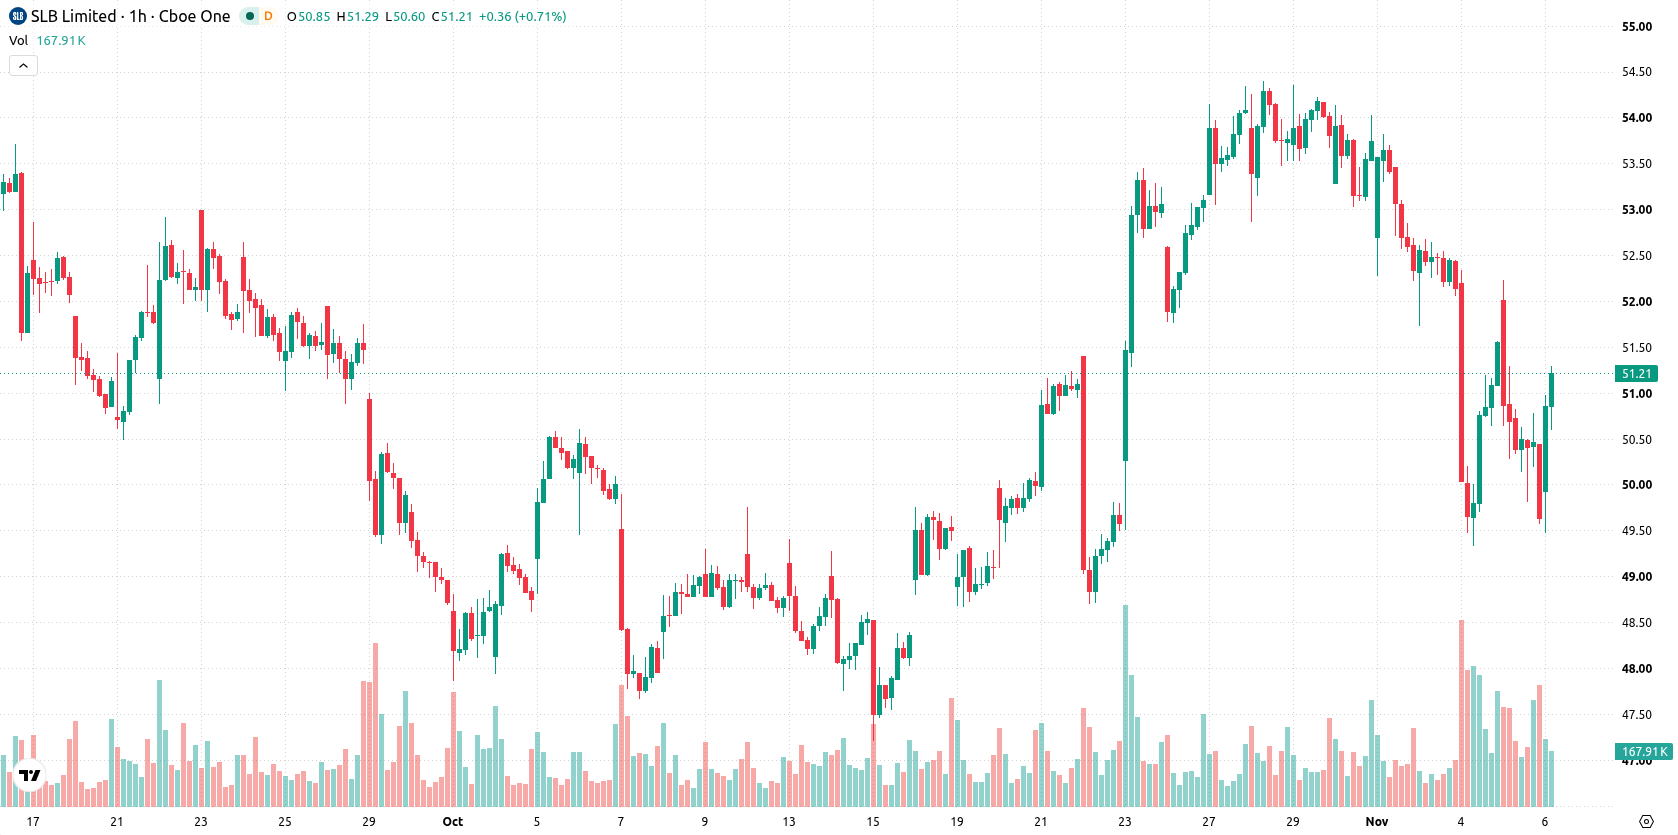
SLB (SLB) stock is trading at $51.21 after gaining 3.16% on the day. The price currently sits above its key short-term moving average but remains below the longer-term averages.
 51.69
51.69
Highlights
- SLB reported mixed third quarter earnings and won new contracts, supporting business stability and adding new revenue streams.
- Revenue grew sequentially across all main divisions, sustaining expansion and supporting future cash flow generation.
- SLB stock closed at $51.21, with short-term bullish price action but prevailing medium- and long-term bearish signals; price is expected to consolidate within $49.21 to $53.21.
Revenue growth and digital partnerships drive improved sentiment
SLB’s recent mixed third quarter earnings report, delivered alongside the announcement of fresh contract wins, has provided investors with confirmation of both business stability and new revenue inflows. Sequential revenue growth across all principal operating divisions, as highlighted on the third-quarter earnings call, reinforces the company's expansion track record and supports forward cash flow generation. The newly announced Canadian facility partnership with Meta further diversifies SLB's portfolio, positioning the company to tap demand from the digital infrastructure and data center sectors.
Resistance and mixed momentum as indicators signal potential pullback
Technically, SLB is trading above its MA-20 but remains below the MA-50 on the H1 timeframe, while staying under the long-term MA-200. The Ichimoku Kijun level at $51.4 stands as immediate resistance. Among indicators, MACD signals a strong sell and ADX points to ongoing selling pressure. RSI and CCI both sit in neutral zones, while Stochastic RSI is in the overbought area, suggesting potential for a short-term pullback. Bull/Bear Power is slightly positive, reflecting a balance of buyers and sellers in intraday trading.
Range-bound outlook with downside risk as breakout levels watched
For the coming sessions, SLB’s price is likely to trade within the $49.21 to $53.21 volatility band. The probability of an upward break is estimated at 42%, while a downward move is slightly more likely at 58%. Base scenario anticipates continued consolidation within this range. A decisive bullish move would require a breakout above the $51.4 resistance area, whereas a drop below the lower boundary could see further downside develop.
Earlier, analysts noted that SLB's improving financial performance and integration of recent acquisitions positioned the company for a period of consolidation with potential for further gains. The current setup adds a new dimension with mixed technicals and portfolio diversification, highlighting $51.4 as an immediate resistance level for traders to monitor for a possible directional breakout.









-
 Afghanistan
-
 Albania
-
 Algeria
-
 Angola
-
 Argentina
-
 Armenia
-
 Australia
-
 Austria
-
 Azerbaijan
-
 Bahamas
-
 Bahrain
-
 Bangladesh
-
 Belarus
-
 Belgium
-
 Bolivia
-
 Botswana
-
 Brazil
-
 Brunei
-
 Bulgaria
-
 Cambodia
-
 Cameroon
-
 Canada
-
 Chile
-
 China
-
 Colombia
-
 Congo
-
 Costa Rica
-
 Cote d'Ivoire
-
 Croatia
-
 Cuba
-
 Cyprus
-
 Czechia
-
 DR Congo
-
 Denmark
-
 Dominican Republic
-
 Ecuador
-
 Egypt
-
 El Salvador
-
 Estonia
-
 Eswatini
-
 Ethiopia
-
 Finland
-
 France
-
 Georgia
-
 Germany
-
 Ghana
-
 Greece
-
 Haiti
-
 Hong Kong
-
 Hungary
-
 India
-
 Indonesia
-
 Iran, Islamic republic
-
 Iraq
-
 Ireland
-
 Israel
-
 Italy
-
 Jamaica
-
 Japan
-
 Jordan
-
 Kazakhstan
-
 Kenya
-
 Korea
-
 Kuwait
-
 Kyrgyzstan
-
 Laos
-
 Latvia
-
 Lebanon
-
 Lesotho
-
 Libya
-
 Lithuania
-
 Luxembourg
-
 Madagascar
-
 Malaysia
-
 Malta
-
 Mauritius
-
 Mexico
-
 Moldova
-
 Mongolia
-
 Montenegro
-
 Morocco
-
 Mozambique
-
 Myanmar
-
 Namibia
-
 Nepal
-
 Netherlands
-
 New Zealand
-
 Nigeria
-
 North Macedonia
-
 Norway
-
 Oman
-
 Pakistan
-
 Palestine
-
 Panama
-
 Papua New Guinea
-
 Paraguay
-
 Peru
-
 Philippines
-
 Poland
-
 Portugal
-
 Puerto Rico
-
 Qatar
-
 Reunion
-
 Romania
-
 Rwanda
-
 Saudi Arabia
-
 Serbia
-
 Singapore
-
 Slovakia
-
 Slovenia
-
 Somalia
-
 South Africa
-
 Spain
-
 Sri Lanka
-
 Sweden
-
 Switzerland
-
 Syria
-
 Taiwan
-
 Tajikistan
-
 Tanzania
-
 Thailand
-
 Trinidad and Tobago
-
 Tunisia
-
 Turkey
-
 UAE
-
 Uganda
-
 Ukraine
-
 United Kingdom
-
United States
-
 Uruguay
-
 Uzbekistan
-
 Venezuela
-
 Vietnam
-
 Yemen
-
 Zambia
-
 Zimbabwe
- Forex
- Crypto












