


SLB (SLB) stock is trading at $48.13, showing a daily decline of 3.75%. The price sits below its key moving averages, indicating ongoing selling pressure.
 54.13
54.36
Highlights
- SLB reported adjusted earnings of 55 cents per share for the second quarter, exceeding analyst expectations of 51 cents.
- Jing Ulrich joined the Board of Directors and audit committees, expanding SLB's governance capabilities.
- Shares of SLB trade below key moving averages and face sustained selling, with an expected range of $46.85 to $50.1 and a 65% probability of downside.
Profit beat and governance changes fail to reverse current pressure
SLB outperformed in the second quarter, reporting adjusted earnings of 55 cents per share, which exceeded analyst expectations of 51 cents according to Energynow. This profit beat, driven by resilient demand across key markets, highlights improved underlying financial strength but has not offset current price weakness. Separately, SLB announced the appointment of Jing Ulrich to its Board of Directors and audit committees as reported by Tradingview, broadening its governance profile though price action has remained under broader selling pressure.
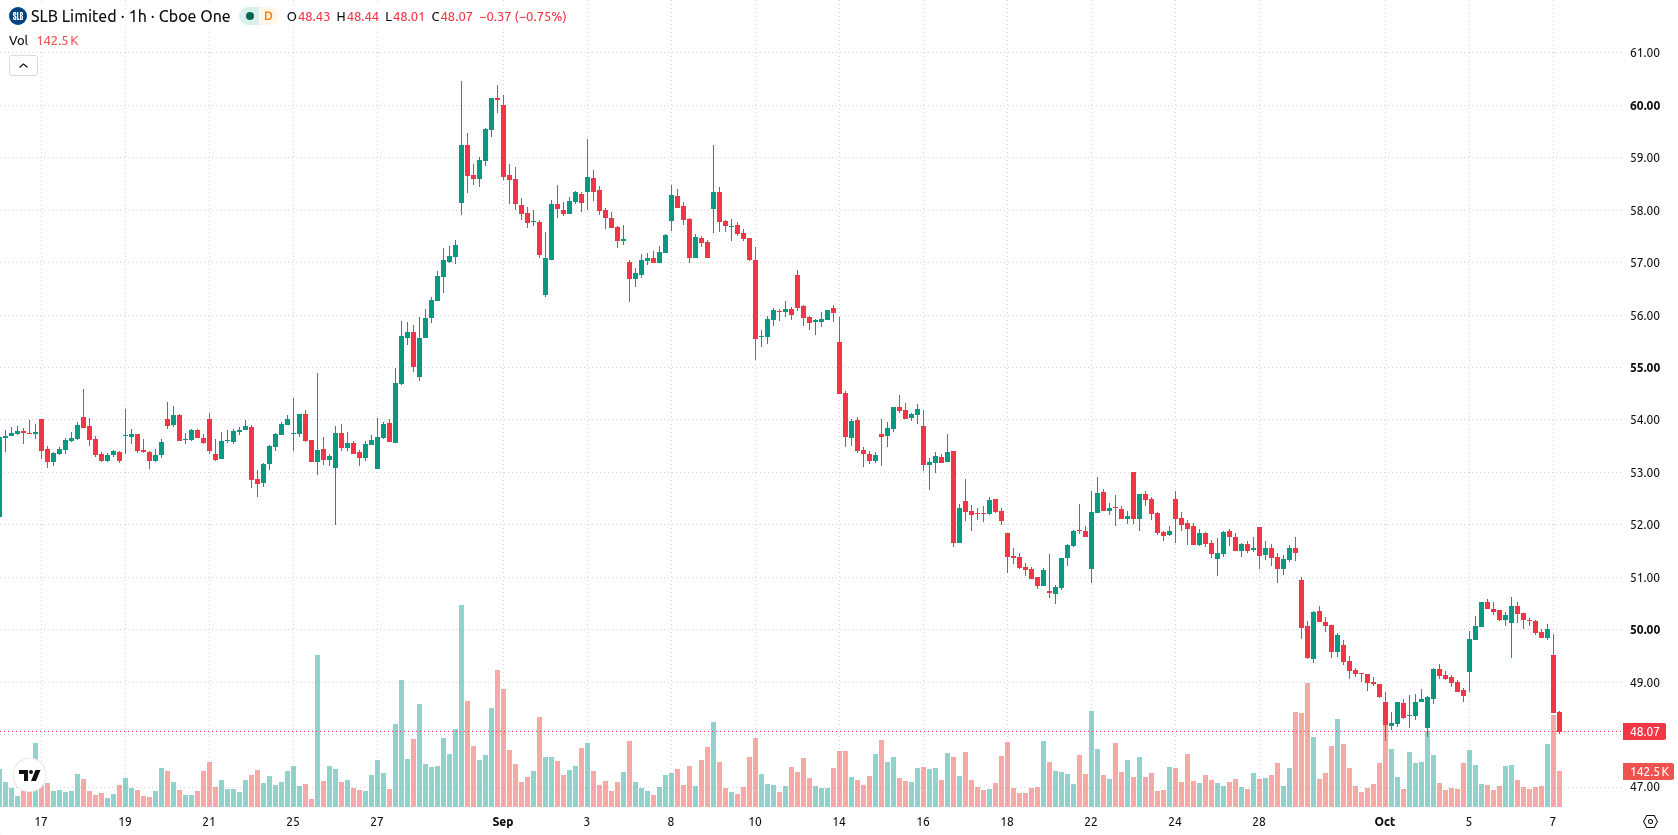
Mixed momentum and resistance cap rebound risk despite intraday buyers
On the h1 chart, SLB is trading below the MA-20 ($49.83) and MA-50 ($49.78), while on the daily timeframe, it remains below the MA-200 ($50.61). The Ichimoku Kijun currently stands at $49.28 and acts as immediate resistance. Momentum signals are mixed: MACD points to strong buy momentum, ADX signals a sell, RSI is at 53.21 (Buy), Stoch RSI is oversold, and CCI is neutral. Intraday, Bull/Bear Power indicates strong buyer activity, but with the Awesome Oscillator neutral, the technical landscape supports a potential intraday rebound while the broader setup stays uncertain.
Sideways trading expected as bearish risk overshadows upside potential
In the near term, SLB is expected to trade within a range of $46.85 to $50.1, reflecting typical volatility bands seen in current conditions. The probability of a move higher is estimated at 35%, while a downward continuation holds a 65% likelihood. The base scenario sees SLB moving sideways within this range, with a bullish breakout scenario triggered by a close above $49.28 and a bearish scenario materializing if support at $46.85 breaks.
Earlier, analysts noted that Schlumberger’s share price had been constrained by persistent downside risks and weak momentum despite some signs of technical recovery. With SLB now showing broad-based selling pressure even after an earnings beat and governance changes, traders should watch for a sustained move above $49.28 or below $46.85 to indicate the next meaningful directional shift.






Latest Schlumberger News





-
 Afghanistan
-
 Albania
-
 Algeria
-
 Angola
-
 Argentina
-
 Armenia
-
 Australia
-
 Austria
-
 Azerbaijan
-
 Bahamas
-
 Bahrain
-
 Bangladesh
-
 Belarus
-
 Belgium
-
 Bolivia
-
 Botswana
-
 Brazil
-
 Brunei
-
 Bulgaria
-
 Cambodia
-
 Cameroon
-
 Canada
-
 Chile
-
 China
-
 Colombia
-
 Congo
-
 Costa Rica
-
 Cote d'Ivoire
-
 Croatia
-
 Cuba
-
 Cyprus
-
 Czechia
-
 DR Congo
-
 Denmark
-
 Dominican Republic
-
 Ecuador
-
 Egypt
-
 El Salvador
-
 Estonia
-
 Eswatini
-
 Ethiopia
-
 Finland
-
 France
-
 Georgia
-
 Germany
-
 Ghana
-
 Greece
-
 Haiti
-
 Hong Kong
-
 Hungary
-
 India
-
 Indonesia
-
 Iran, Islamic republic
-
 Iraq
-
 Ireland
-
 Israel
-
 Italy
-
 Jamaica
-
 Japan
-
 Jordan
-
 Kazakhstan
-
 Kenya
-
 Korea
-
 Kuwait
-
 Kyrgyzstan
-
 Laos
-
 Latvia
-
 Lebanon
-
 Lesotho
-
 Libya
-
 Lithuania
-
 Luxembourg
-
 Madagascar
-
 Malaysia
-
 Malta
-
 Mauritius
-
 Mexico
-
 Moldova
-
 Mongolia
-
 Montenegro
-
 Morocco
-
 Mozambique
-
 Myanmar
-
 Namibia
-
 Nepal
-
 Netherlands
-
 New Zealand
-
 Nigeria
-
 North Macedonia
-
 Norway
-
 Oman
-
 Pakistan
-
 Palestine
-
 Panama
-
 Papua New Guinea
-
 Paraguay
-
 Peru
-
 Philippines
-
 Poland
-
 Portugal
-
 Puerto Rico
-
 Qatar
-
 Reunion
-
 Romania
-
 Rwanda
-
 Saudi Arabia
-
 Serbia
-
 Singapore
-
 Slovakia
-
 Slovenia
-
 Somalia
-
 South Africa
-
 Spain
-
 Sri Lanka
-
 Sweden
-
 Switzerland
-
 Syria
-
 Taiwan
-
 Tajikistan
-
 Tanzania
-
 Thailand
-
 Trinidad and Tobago
-
 Tunisia
-
 Turkey
-
 UAE
-
 Uganda
-
 Ukraine
-
 United Kingdom
-
United States
-
 Uruguay
-
 Uzbekistan
-
 Venezuela
-
 Vietnam
-
 Yemen
-
 Zambia
-
 Zimbabwe
- Forex
- Crypto












