

Why is Schlumberger stock up today? Rebound and $51.61 resistance levels in focus

Schlumberger (SLB) stock is trading at $50.23, up 3.06% on the day and closing near its session high. The stock sits above its main short-term and medium-term moving averages, indicating positive momentum against these benchmarks.
 53.81
54.36
Highlights
- Schlumberger reported a 5.6% decline in net income to $752 million, citing lower oilfield activity in the Middle East due to regional conflict.
- Geopolitical instability continues to suppress client demand in a key market, exerting pressure on Schlumberger's profitability.
- SLB/USD closed up 3.06% at $50.23 after high volatility, but short- and medium-term technicals show selling momentum with a projected range of $48.85 to $51.61 and a 60% probability of downside movement.
Profit decline driven by Middle East instability limits adaptability outlook
Schlumberger reported a 5.6% decline in net income to $752 million for the most recent quarter, attributing the decrease to reduced oilfield activity in the Middle East amid the Iran conflict, according to Energynow. This earnings result reflects the ongoing impact of regional geopolitical instability on client demand, constraining the company's profitability in a key market. Despite the diminished earnings and external pressures, the market is actively weighing Schlumberger's ability to adapt operations and maintain its global service presence.
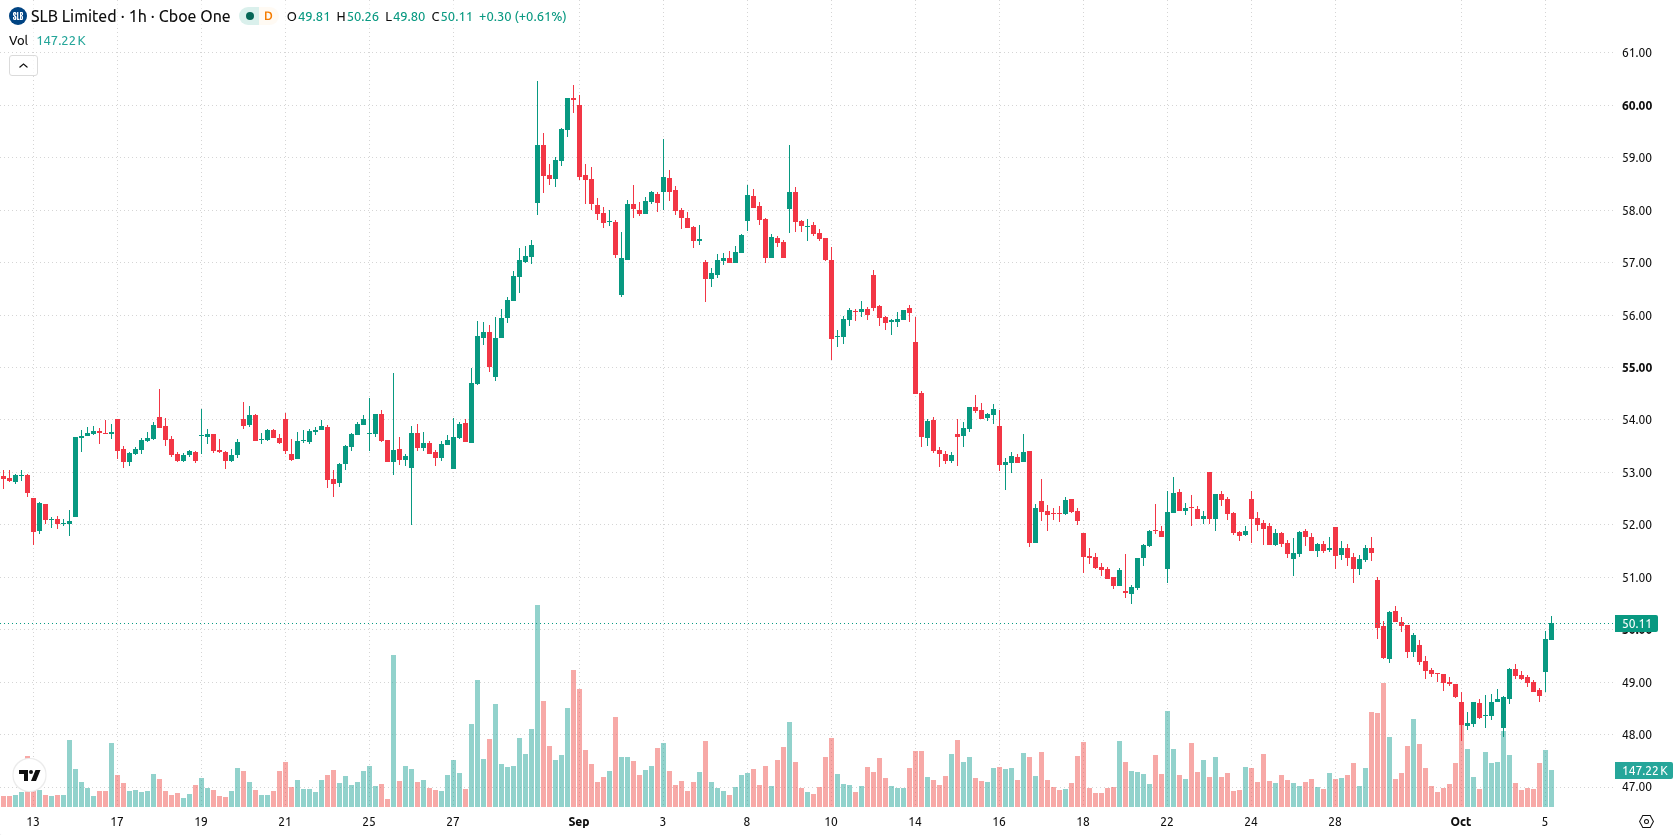
Divergence grows as price recovers but momentum signals weaken
SLB is currently trading above the MA-20 at $48.79 and the MA-50 at $50.21, but remains below the MA-200 at $50.49. The Ichimoku Kijun at $49.16 provides immediate technical support. MACD is producing a strong sell signal, while ADX reflects persistent selling momentum. RSI stands at 39.83, supporting a sell bias. Stochastic RSI and CCI both indicate neutral conditions, though Bull/Bear Power shows sellers continue to dominate intraday activity. The Awesome Oscillator remains neutral, contributing no confirmation for the prevailing price trend. A sharp intraday price recovery is evident, standing in contrast to weak underlying momentum and generating a notable divergence.
Range-bound outlook persists amid skewed downside risk
Over the next two to three trading days, SLB is expected to trade within a volatility band of $48.85 to $51.61. There is a 40% likelihood of an upward move and a 60% chance of downward price action. The baseline scenario calls for the price to remain range-bound within this corridor, oscillating between the immediate support at $48.85 and resistance at $51.61. A decisive breakout above resistance would open the possibility for renewed upside momentum, while a break below support could accelerate selling toward the next lower price zone.
Earlier, analysts noted the significant impact of geopolitical developments in the Middle East on major energy and infrastructure companies, particularly those with exposure to the region. The current technical landscape for Schlumberger underscores the importance of monitoring the $48.85 support and $51.61 resistance levels, as a breakout on either side could signal the next directional move for the stock.






Latest Schlumberger News





-
 Afghanistan
-
 Albania
-
 Algeria
-
 Angola
-
 Argentina
-
 Armenia
-
 Australia
-
 Austria
-
 Azerbaijan
-
 Bahamas
-
 Bahrain
-
 Bangladesh
-
 Belarus
-
 Belgium
-
 Bolivia
-
 Botswana
-
 Brazil
-
 Brunei
-
 Bulgaria
-
 Cambodia
-
 Cameroon
-
 Canada
-
 Chile
-
 China
-
 Colombia
-
 Congo
-
 Costa Rica
-
 Cote d'Ivoire
-
 Croatia
-
 Cuba
-
 Cyprus
-
 Czechia
-
 DR Congo
-
 Denmark
-
 Dominican Republic
-
 Ecuador
-
 Egypt
-
 El Salvador
-
 Estonia
-
 Eswatini
-
 Ethiopia
-
 Finland
-
 France
-
 Georgia
-
 Germany
-
 Ghana
-
 Greece
-
 Haiti
-
 Hong Kong
-
 Hungary
-
 India
-
 Indonesia
-
 Iran, Islamic republic
-
 Iraq
-
 Ireland
-
 Israel
-
 Italy
-
 Jamaica
-
 Japan
-
 Jordan
-
 Kazakhstan
-
 Kenya
-
 Korea
-
 Kuwait
-
 Kyrgyzstan
-
 Laos
-
 Latvia
-
 Lebanon
-
 Lesotho
-
 Libya
-
 Lithuania
-
 Luxembourg
-
 Madagascar
-
 Malaysia
-
 Malta
-
 Mauritius
-
 Mexico
-
 Moldova
-
 Mongolia
-
 Montenegro
-
 Morocco
-
 Mozambique
-
 Myanmar
-
 Namibia
-
 Nepal
-
 Netherlands
-
 New Zealand
-
 Nigeria
-
 North Macedonia
-
 Norway
-
 Oman
-
 Pakistan
-
 Palestine
-
 Panama
-
 Papua New Guinea
-
 Paraguay
-
 Peru
-
 Philippines
-
 Poland
-
 Portugal
-
 Puerto Rico
-
 Qatar
-
 Reunion
-
 Romania
-
 Rwanda
-
 Saudi Arabia
-
 Serbia
-
 Singapore
-
 Slovakia
-
 Slovenia
-
 Somalia
-
 South Africa
-
 Spain
-
 Sri Lanka
-
 Sweden
-
 Switzerland
-
 Syria
-
 Taiwan
-
 Tajikistan
-
 Tanzania
-
 Thailand
-
 Trinidad and Tobago
-
 Tunisia
-
 Turkey
-
 UAE
-
 Uganda
-
 Ukraine
-
 United Kingdom
-
United States
-
 Uruguay
-
 Uzbekistan
-
 Venezuela
-
 Vietnam
-
 Yemen
-
 Zambia
-
 Zimbabwe
- Forex
- Crypto












