

Robinhood declines as bearish trend persists despite oversold signals

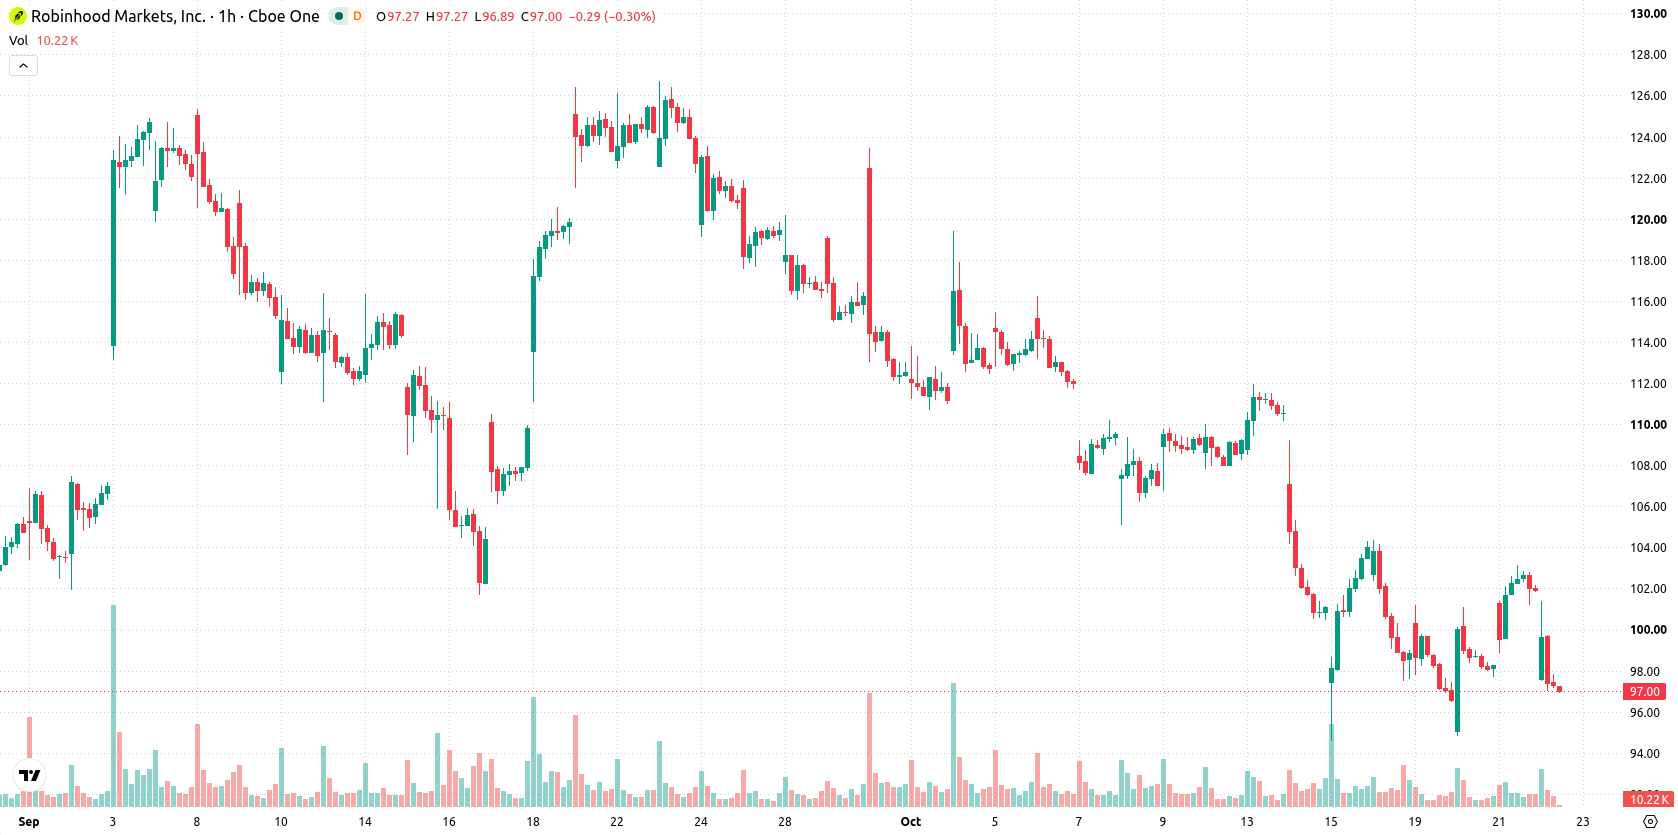
Robinhood (HOOD) stock is trading at $97.4 after a drop of 4.44% today. The price is currently below its key short- and medium-term moving averages, with only the long-term average still acting as a potential support.
 85.19
88.71
Highlights
- Robinhood launched its public mainnet, Robinhood Chain, using Arbitrum to enable tokenized assets, lending, and borrowing.
- The company plans to expand retail investing services to the Middle East in 2027 by operating in Dubai.
- Shares of Robinhood dropped 4.44% to $97.4, trading below short- and medium-term moving averages with continued seller dominance and intraday volatility; technicals assign a very high probability of further declines and an expected near-term range of $93.16 to $104.62.
Platform expansion and Dubai plans amid ongoing selling pressure
On July 1, 2026, Robinhood launched its public mainnet, Robinhood Chain, leveraging Arbitrum technology to introduce blockchain-based support for tokenized assets, lending, and borrowing, according to Tokenpost. This completed product event broadens Robinhood's platform capabilities and diversifies its underlying revenue streams by entering the digital assets ecosystem. Additionally, Robinhood revealed plans to expand into the Middle East retail investing market in 2027 through a new Dubai operation, as reported by Newsquawk, though price action has remained under broader selling pressure.
Sustained bearish momentum as key resistance holds
On the technical front, HOOD is trading below the MA-20 and MA-50 on the hourly chart, indicating sustained short- and medium-term downside momentum, while the long-term MA-200 at lower levels still offers potential support. Key resistance stands at the Ichimoku Kijun, currently set at $98.99. Momentum readings remain heavily bearish: MACD and ADX both signal active selling pressure, and the RSI, CCI, Stoch RSI, and Bull/Bear Power all reflect oversold or hard-sell conditions. The Awesome Oscillator also confirms the prevailing downward bias, with price action near the session lows and high volatility persisting.
Downside risk dominates as rebound chances fade
Looking ahead, the likely trading band for HOOD over the next several sessions is expected to be between $93.16 and $104.62, reflecting continued volatility. The probability of a significant upward rebound remains very low, while downside risks are elevated. The baseline scenario projects HOOD holding within this range in the near term. A breakout above $98.99 could trigger a swift rally towards the upper end of the band, while a drop below $93.16 would open the way for further declines.
Previously it was reported that Robinhood expanded its blockchain presence by debuting the Robinhood Chain and integrating with third-party platforms like Uniswap to support tokenized assets and decentralized finance services. With price action now showing extended downside momentum despite these strategic moves, traders should closely monitor the $93.16 support level for potential breakdown risk amid ongoing volatility.











-
 Afghanistan
-
 Albania
-
 Algeria
-
 Angola
-
 Argentina
-
 Armenia
-
 Australia
-
 Austria
-
 Azerbaijan
-
 Bahamas
-
 Bahrain
-
 Bangladesh
-
 Belarus
-
 Belgium
-
 Bolivia
-
 Botswana
-
 Brazil
-
 Brunei
-
 Bulgaria
-
 Cambodia
-
 Cameroon
-
 Canada
-
 Chile
-
 China
-
 Colombia
-
 Congo
-
 Costa Rica
-
 Cote d'Ivoire
-
 Croatia
-
 Cuba
-
 Cyprus
-
 Czechia
-
 DR Congo
-
 Denmark
-
 Dominican Republic
-
 Ecuador
-
 Egypt
-
 El Salvador
-
 Estonia
-
 Eswatini
-
 Ethiopia
-
 Finland
-
 France
-
 Georgia
-
 Germany
-
 Ghana
-
 Greece
-
 Haiti
-
 Hong Kong
-
 Hungary
-
 India
-
 Indonesia
-
 Iran, Islamic republic
-
 Iraq
-
 Ireland
-
 Israel
-
 Italy
-
 Jamaica
-
 Japan
-
 Jordan
-
 Kazakhstan
-
 Kenya
-
 Korea
-
 Kuwait
-
 Kyrgyzstan
-
 Laos
-
 Latvia
-
 Lebanon
-
 Lesotho
-
 Libya
-
 Lithuania
-
 Luxembourg
-
 Madagascar
-
 Malaysia
-
 Malta
-
 Mauritius
-
 Mexico
-
 Moldova
-
 Mongolia
-
 Montenegro
-
 Morocco
-
 Mozambique
-
 Myanmar
-
 Namibia
-
 Nepal
-
 Netherlands
-
 New Zealand
-
 Nigeria
-
 North Macedonia
-
 Norway
-
 Oman
-
 Pakistan
-
 Palestine
-
 Panama
-
 Papua New Guinea
-
 Paraguay
-
 Peru
-
 Philippines
-
 Poland
-
 Portugal
-
 Puerto Rico
-
 Qatar
-
 Reunion
-
 Romania
-
 Rwanda
-
 Saudi Arabia
-
 Serbia
-
 Singapore
-
 Slovakia
-
 Slovenia
-
 Somalia
-
 South Africa
-
 Spain
-
 Sri Lanka
-
 Sweden
-
 Switzerland
-
 Syria
-
 Taiwan
-
 Tajikistan
-
 Tanzania
-
 Thailand
-
 Trinidad and Tobago
-
 Tunisia
-
 Turkey
-
 UAE
-
 Uganda
-
 Ukraine
-
 United Kingdom
-
United States
-
 Uruguay
-
 Uzbekistan
-
 Venezuela
-
 Vietnam
-
 Yemen
-
 Zambia
-
 Zimbabwe
- Forex
- Crypto












