

Vodafone shares drop nearly 2% after technical indicators point to oversold conditions

Vodafone Group plc (VOD) declined 1.71% after opening with a downside gap, as short- and medium-term selling pressure continues to weigh on the stock. The move is limited, with Vodafone trading below both its 20-day and 50-day moving averages but still showing strength above the 200-day average, suggesting longer-term support remains.
 118.55
122.55
Highlights
- Vodafone published a regulatory TR-1 notification to remind shareholders of their FCA disclosure obligations, with no material corporate news or regulatory events reported.
- Vodafone stock remains in a low-volatility technical consolidation range and continues to face selling pressure.
- Vodafone trades below key short- and medium-term averages with indicators showing mixed signals and an expected range of GBX115.88 to GBX121.63 in the next five days.
Shareholding disclosure and muted news as selling persists
Vodafone published a regulatory TR-1 notification regarding major shareholdings, reminding shareholders of their obligations under FCA disclosure rules. The company has remained within a technical consolidation range, reflecting low volatility and a lack of significant news catalysts. No major corporate actions, regulatory changes, or ecosystem developments were reported for Vodafone, though price action has remained under broader selling pressure.
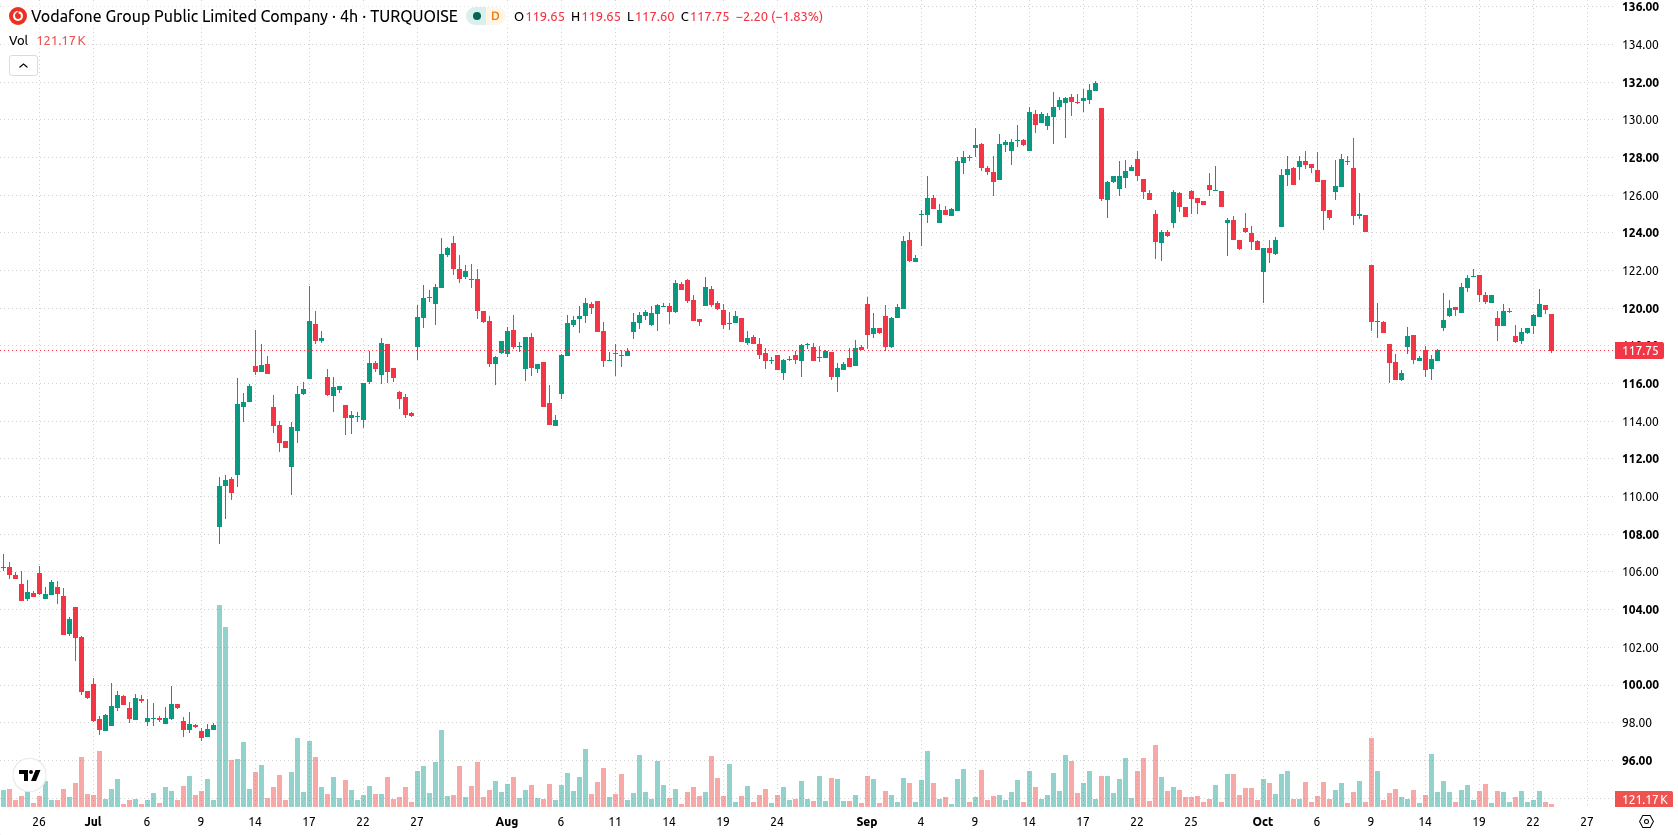
Mixed momentum and oversold signals amid technical compression
Vodafone is currently trading below both its 20-day and 50-day moving averages (GBX122.09 and GBX122.86), but remains above the 200-day moving average at GBX114.35. This setup reflects ongoing short- and medium-term pressure from sellers, yet provides a supportive longer-term trend. The near-term ceiling stands at GBX118.05, with the nearest support at GBX115.88, while the Ichimoku Kijun (GBX124.05) acts as a distant resistance level. Momentum signals are mixed: the MACD indicates selling pressure, ADX points to a neutral trend environment, and both the RSI and CCI are in sell territory, suggesting a bias toward oversold conditions. In contrast, the Stochastic RSI signals a buy opportunity, creating some divergence among oscillators. Bull/Bear Power (BBP) remains slightly positive at 0.39, reflecting a modest intraday edge for buyers, although the overall forecast still classifies the stock as oversold. Vodafone is trading near the low of the day with volatility at 2.07% as sellers have dominated the session.
Earlier, analysts noted that Vodafone’s technical outlook was mixed, with consolidation favored amid persistent downside risks. The latest price action and indicator signals reinforce this view, suggesting traders should watch the GBX115.88 support and GBX118.05 resistance for signs of a directional breakout.









-
 Afghanistan
-
 Albania
-
 Algeria
-
 Angola
-
 Argentina
-
 Armenia
-
 Australia
-
 Austria
-
 Azerbaijan
-
 Bahamas
-
 Bahrain
-
 Bangladesh
-
 Belarus
-
 Belgium
-
 Bolivia
-
 Botswana
-
 Brazil
-
 Brunei
-
 Bulgaria
-
 Cambodia
-
 Cameroon
-
 Canada
-
 Chile
-
 China
-
 Colombia
-
 Congo
-
 Costa Rica
-
 Cote d'Ivoire
-
 Croatia
-
 Cuba
-
 Cyprus
-
 Czechia
-
 DR Congo
-
 Denmark
-
 Dominican Republic
-
 Ecuador
-
 Egypt
-
 El Salvador
-
 Estonia
-
 Eswatini
-
 Ethiopia
-
 Finland
-
 France
-
 Georgia
-
 Germany
-
 Ghana
-
 Greece
-
 Haiti
-
 Hong Kong
-
 Hungary
-
 India
-
 Indonesia
-
 Iran, Islamic republic
-
 Iraq
-
 Ireland
-
 Israel
-
 Italy
-
 Jamaica
-
 Japan
-
 Jordan
-
 Kazakhstan
-
 Kenya
-
 Korea
-
 Kuwait
-
 Kyrgyzstan
-
 Laos
-
 Latvia
-
 Lebanon
-
 Lesotho
-
 Libya
-
 Lithuania
-
 Luxembourg
-
 Madagascar
-
 Malaysia
-
 Malta
-
 Mauritius
-
 Mexico
-
 Moldova
-
 Mongolia
-
 Montenegro
-
 Morocco
-
 Mozambique
-
 Myanmar
-
 Namibia
-
 Nepal
-
 Netherlands
-
 New Zealand
-
 Nigeria
-
 North Macedonia
-
 Norway
-
 Oman
-
 Pakistan
-
 Palestine
-
 Panama
-
 Papua New Guinea
-
 Paraguay
-
 Peru
-
 Philippines
-
 Poland
-
 Portugal
-
 Puerto Rico
-
 Qatar
-
 Reunion
-
 Romania
-
 Rwanda
-
 Saudi Arabia
-
 Serbia
-
 Singapore
-
 Slovakia
-
 Slovenia
-
 Somalia
-
 South Africa
-
 Spain
-
 Sri Lanka
-
 Sweden
-
 Switzerland
-
 Syria
-
 Taiwan
-
 Tajikistan
-
 Tanzania
-
 Thailand
-
 Trinidad and Tobago
-
 Tunisia
-
 Turkey
-
 UAE
-
 Uganda
-
 Ukraine
-
 United Kingdom
-
United States
-
 Uruguay
-
 Uzbekistan
-
 Venezuela
-
 Vietnam
-
 Yemen
-
 Zambia
-
 Zimbabwe
- Forex
- Crypto












