

What's behind Procter & Gamble's latest stock pullback?

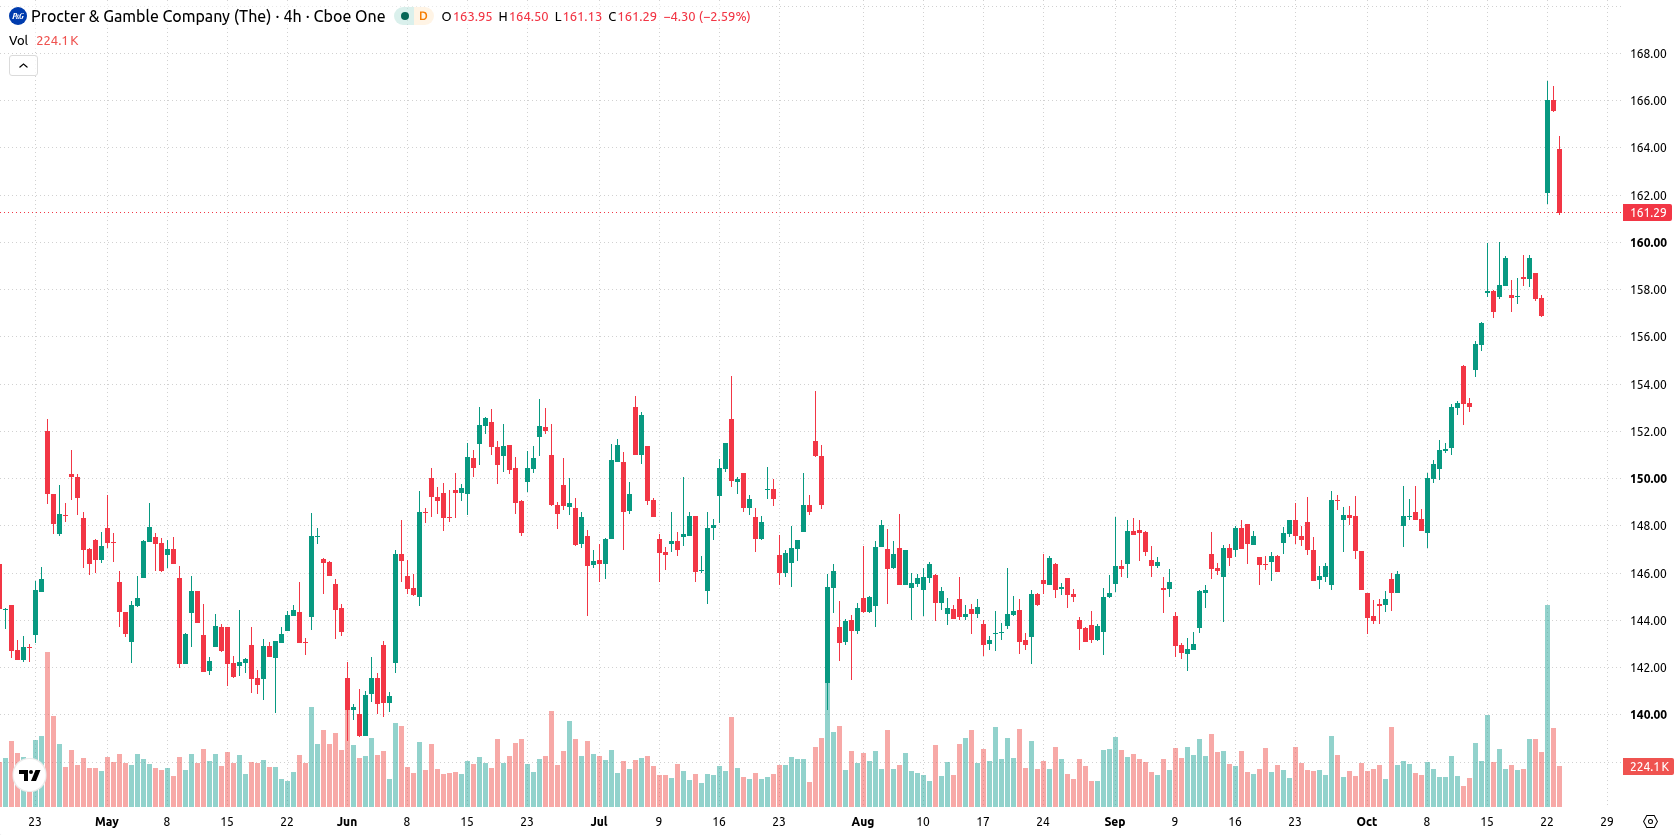
The Procter & Gamble Company (PG) fell 2.71% after an initial downside gap, even as its fiscal Q1 2027 earnings beat estimates and showcased resilient demand for core products. The decline stands out against generally bullish technical signals, with the stock trading above key medium- and long-term moving averages.
 163.57
161.21
Highlights
- Procter & Gamble delivered fiscal Q1 2027 core EPS of $2.00 and revenue of $23.28 billion, both ahead of consensus estimates.
- Organic sales increased 4% with higher demand for laundry and home care, and the company maintained full-year guidance while raising cost headwind estimates.
- Shares of Procter & Gamble trade above key moving averages with technical indicators in overbought territory, expecting a fluctuation between $156.14 and $166.13 over the next five days.
Shareholder returns and cost headwinds as bullish results face selling
Procter & Gamble reported fiscal Q1 2027 results with core EPS of $2.00 and revenue of $23.28 billion, both ahead of analyst expectations. Organic sales rose 4%, driven by increased demand for laundry and home care items. The company maintained its full-year guidance, increased its cost headwind estimates, and returned $3.9 billion to shareholders through dividends and share buybacks. These results were accompanied by ongoing plans for over $10 billion in dividends and $5 billion in share repurchases for the fiscal year, though price action has remained under broader selling pressure.
Overbought signals contrast intraday dip as technical momentum persists
Procter & Gamble is trading above its 20-day, 50-day, and 200-day moving averages ($152.03, $148.04, and $148.4 respectively), reflecting underlying medium- and long-term bullish momentum. Near-term, the price is being tested at the $161.87 level, which acts as the closest ceiling, with floor support at the weekly low of $156.84. The Ichimoku Kijun ($155.12) and all major moving averages confirm a supportive longer-term trend, although the MA-50 vs MA-200 alignment remains bearish. Momentum readings show the MACD and Average Directional Index (ADX) continue to forecast sustained buying interest. The Relative Strength Index (RSI) at 74.84 and Commodity Channel Index (CCI) at 181.36, along with the Stochastic RSI at 97.07, signal clear overbought conditions. Bull/Bear Power (BBP) is firmly positive at 10.78, indicating buyers clearly dominate intraday momentum and reinforcing the overbought call. The Awesome Oscillator also supports the bullish trend. The daily move shows the stock down to $161.14, dropping $4.49 or 2.71% after opening with a downside gap of about 1.05%. The price is positioned near its daily low, intraday volatility stands at 1.50%, and near-term tone leans toward selling pressure after the open. Intraday weakness runs counter to the ongoing high-momentum readings, highlighting a divergence between persistent bullish signals and current selling.
Previously it was reported that Procter & Gamble shares were consolidating within a defined range following strong earnings and ongoing capital returns. The latest action introduces a divergence between bullish technical momentum and immediate selling pressure, making a decisive move above $161.87 or below $156.84 the key signal to watch for direction in the coming sessions.











-
 Afghanistan
-
 Albania
-
 Algeria
-
 Angola
-
 Argentina
-
 Armenia
-
 Australia
-
 Austria
-
 Azerbaijan
-
 Bahamas
-
 Bahrain
-
 Bangladesh
-
 Belarus
-
 Belgium
-
 Bolivia
-
 Botswana
-
 Brazil
-
 Brunei
-
 Bulgaria
-
 Cambodia
-
 Cameroon
-
 Canada
-
 Chile
-
 China
-
 Colombia
-
 Congo
-
 Costa Rica
-
 Cote d'Ivoire
-
 Croatia
-
 Cuba
-
 Cyprus
-
 Czechia
-
 DR Congo
-
 Denmark
-
 Dominican Republic
-
 Ecuador
-
 Egypt
-
 El Salvador
-
 Estonia
-
 Eswatini
-
 Ethiopia
-
 Finland
-
 France
-
 Georgia
-
 Germany
-
 Ghana
-
 Greece
-
 Haiti
-
 Hong Kong
-
 Hungary
-
 India
-
 Indonesia
-
 Iran, Islamic republic
-
 Iraq
-
 Ireland
-
 Israel
-
 Italy
-
 Jamaica
-
 Japan
-
 Jordan
-
 Kazakhstan
-
 Kenya
-
 Korea
-
 Kuwait
-
 Kyrgyzstan
-
 Laos
-
 Latvia
-
 Lebanon
-
 Lesotho
-
 Libya
-
 Lithuania
-
 Luxembourg
-
 Madagascar
-
 Malaysia
-
 Malta
-
 Mauritius
-
 Mexico
-
 Moldova
-
 Mongolia
-
 Montenegro
-
 Morocco
-
 Mozambique
-
 Myanmar
-
 Namibia
-
 Nepal
-
 Netherlands
-
 New Zealand
-
 Nigeria
-
 North Macedonia
-
 Norway
-
 Oman
-
 Pakistan
-
 Palestine
-
 Panama
-
 Papua New Guinea
-
 Paraguay
-
 Peru
-
 Philippines
-
 Poland
-
 Portugal
-
 Puerto Rico
-
 Qatar
-
 Reunion
-
 Romania
-
 Rwanda
-
 Saudi Arabia
-
 Serbia
-
 Singapore
-
 Slovakia
-
 Slovenia
-
 Somalia
-
 South Africa
-
 Spain
-
 Sri Lanka
-
 Sweden
-
 Switzerland
-
 Syria
-
 Taiwan
-
 Tajikistan
-
 Tanzania
-
 Thailand
-
 Trinidad and Tobago
-
 Tunisia
-
 Turkey
-
 UAE
-
 Uganda
-
 Ukraine
-
 United Kingdom
-
United States
-
 Uruguay
-
 Uzbekistan
-
 Venezuela
-
 Vietnam
-
 Yemen
-
 Zambia
-
 Zimbabwe
- Forex
- Crypto












