

What's behind Xerox's latest 7.2% stock pullback?

Xerox Corporation (XRX) dropped 7.16% after quarterly earnings of $0.38 per share and revenue of $1.92 billion were reported, even as the company’s annualized dividend of $0.10 per share and ex-dividend date on September 30th remained in focus. The decline is supported by Xerox trading below its 20-day and 50-day moving averages, highlighting persistent short- and medium-term seller pressure despite the longer-term support above the 200-day level.
 1.11
1.28
Highlights
- Xerox posted quarterly revenue of $1.92 billion and earnings per share of $0.38, both above consensus estimates.
- Shares offered an annualized dividend of $0.10 per share for a 3.6% yield, with a payout ratio of -1.36%.
- Xerox stock trades under short- and medium-term averages with compressed trends and a projected range of $2.39 to $2.77 over five sessions.
Earnings beat with dividend yield as selling outweighs payouts
Xerox reported quarterly earnings with revenue of $1.92 billion and earnings per share at $0.38, which exceeded consensus expectations. The company’s most recent ex-dividend date was September 30, 2023, for an annualized dividend of $0.10 per share, reflecting a yield of 3.6%. The dividend payout ratio was reported at -1.36%. The recent financial update was accompanied by these shareholder distributions, though price action has remained under broader selling pressure.
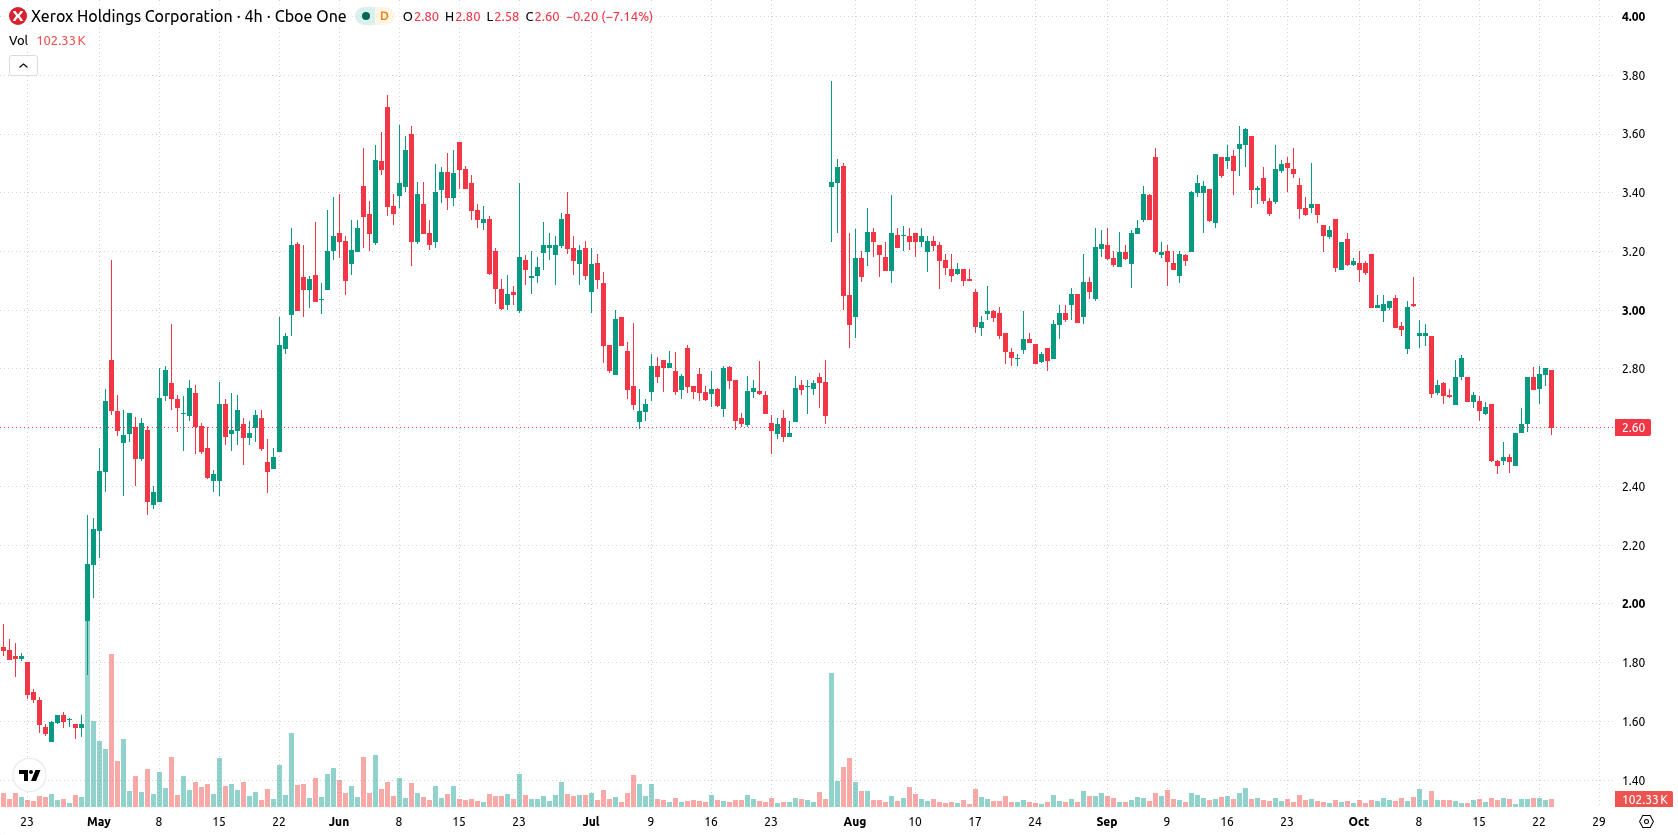
Compressed ranges and mixed signals as seller bias persists
Xerox is trading below its 20-day and 50-day moving averages at $2.89 and $3.07, respectively, but remains above the 200-day average at $2.54. This structure highlights compressed short- and medium-term trends under seller pressure, yet affirms longer-term support, with the near-term ceiling at $2.77 and floor at $2.57. Momentum indicators are mostly negative, with the MACD and Average Directional Index (ADX) both forecasting "Sell" signals. The Relative Strength Index (RSI) at 45.03 forecasts a further decline, while the Stochastic RSI indicates overbought conditions at 100 and the Commodity Channel Index (CCI) is neutral. Bull/Bear Power (BBP) is slightly positive at 0.05, signaling marginal buyer dominance intraday, but the overbought Stochastic RSI tempers this view. The stock opened with a downside gap of about $0.03 (down 1.08%), and has slipped $0.20 or 7.16% so far, now near the session low. Intraday volatility stands at 7.78%, and price action shows continued pressure after the open. Momentum signals are conflicted, reflecting both selling pressure and residual buyer activity during the day.
Earlier, analysts noted that Xerox’s ongoing short- and medium-term technical weakness was offset by underlying long-term support. The latest earnings-driven move intensifies downside risk, making sustained price action above $2.39 pivotal for traders monitoring further volatility.









-
 Afghanistan
-
 Albania
-
 Algeria
-
 Angola
-
 Argentina
-
 Armenia
-
 Australia
-
 Austria
-
 Azerbaijan
-
 Bahamas
-
 Bahrain
-
 Bangladesh
-
 Belarus
-
 Belgium
-
 Bolivia
-
 Botswana
-
 Brazil
-
 Brunei
-
 Bulgaria
-
 Cambodia
-
 Cameroon
-
 Canada
-
 Chile
-
 China
-
 Colombia
-
 Congo
-
 Costa Rica
-
 Cote d'Ivoire
-
 Croatia
-
 Cuba
-
 Cyprus
-
 Czechia
-
 DR Congo
-
 Denmark
-
 Dominican Republic
-
 Ecuador
-
 Egypt
-
 El Salvador
-
 Estonia
-
 Eswatini
-
 Ethiopia
-
 Finland
-
 France
-
 Georgia
-
 Germany
-
 Ghana
-
 Greece
-
 Haiti
-
 Hong Kong
-
 Hungary
-
 India
-
 Indonesia
-
 Iran, Islamic republic
-
 Iraq
-
 Ireland
-
 Israel
-
 Italy
-
 Jamaica
-
 Japan
-
 Jordan
-
 Kazakhstan
-
 Kenya
-
 Korea
-
 Kuwait
-
 Kyrgyzstan
-
 Laos
-
 Latvia
-
 Lebanon
-
 Lesotho
-
 Libya
-
 Lithuania
-
 Luxembourg
-
 Madagascar
-
 Malaysia
-
 Malta
-
 Mauritius
-
 Mexico
-
 Moldova
-
 Mongolia
-
 Montenegro
-
 Morocco
-
 Mozambique
-
 Myanmar
-
 Namibia
-
 Nepal
-
 Netherlands
-
 New Zealand
-
 Nigeria
-
 North Macedonia
-
 Norway
-
 Oman
-
 Pakistan
-
 Palestine
-
 Panama
-
 Papua New Guinea
-
 Paraguay
-
 Peru
-
 Philippines
-
 Poland
-
 Portugal
-
 Puerto Rico
-
 Qatar
-
 Reunion
-
 Romania
-
 Rwanda
-
 Saudi Arabia
-
 Serbia
-
 Singapore
-
 Slovakia
-
 Slovenia
-
 Somalia
-
 South Africa
-
 Spain
-
 Sri Lanka
-
 Sweden
-
 Switzerland
-
 Syria
-
 Taiwan
-
 Tajikistan
-
 Tanzania
-
 Thailand
-
 Trinidad and Tobago
-
 Tunisia
-
 Turkey
-
 UAE
-
 Uganda
-
 Ukraine
-
 United Kingdom
-
United States
-
 Uruguay
-
 Uzbekistan
-
 Venezuela
-
 Vietnam
-
 Yemen
-
 Zambia
-
 Zimbabwe
- Forex
- Crypto












