

Intuit stock falls nearly 3% as overbought signals and resistance cap gains

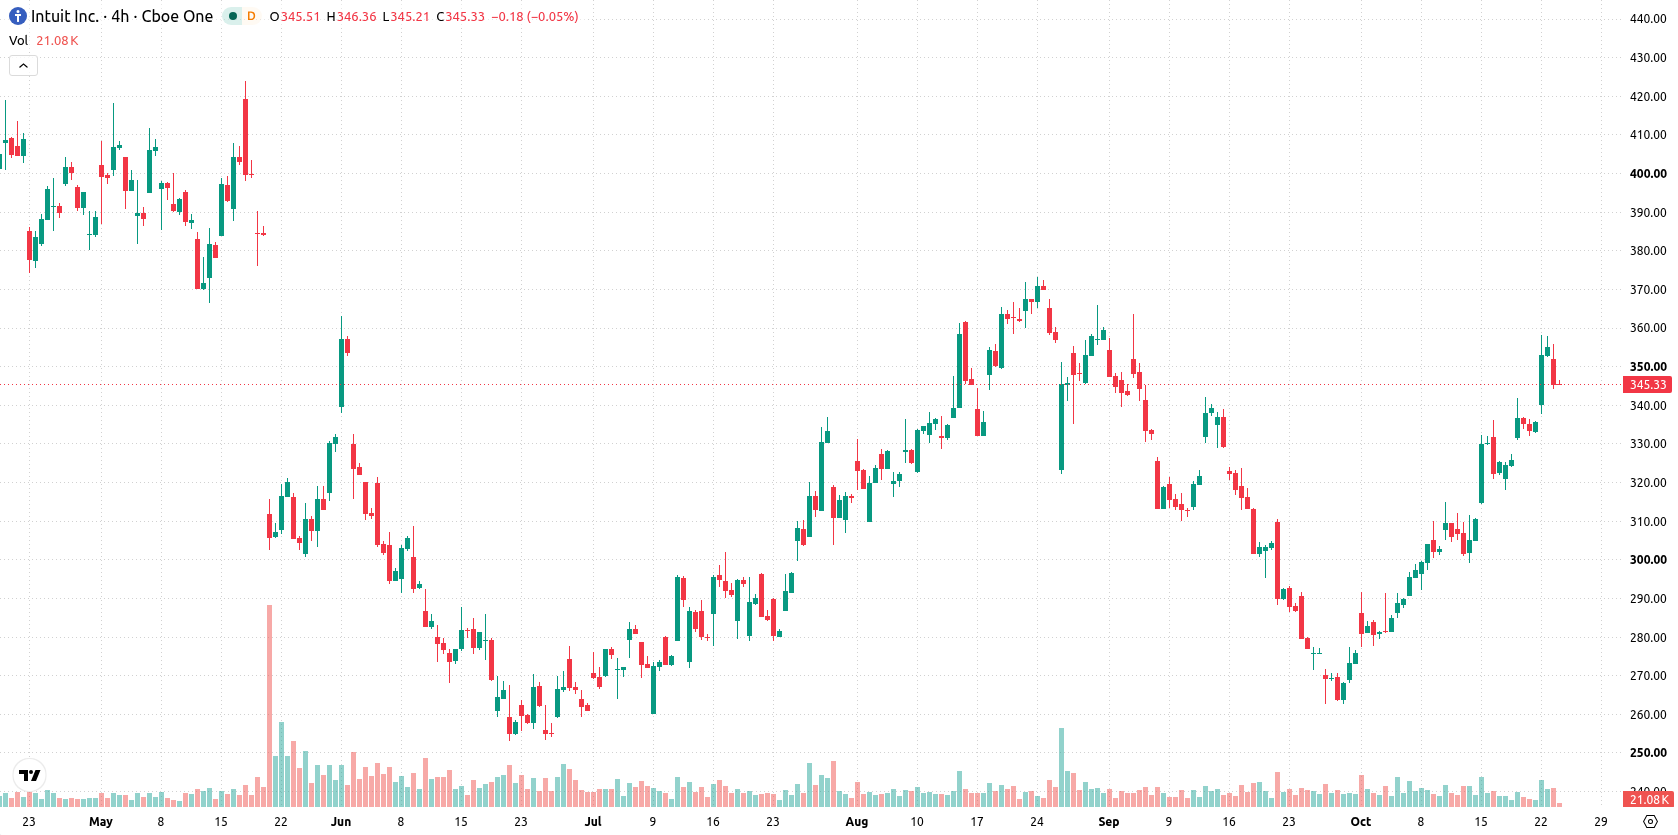
Intuit Inc. (INTU) fell 2.87% after strong momentum signals clashed with signs of overbought conditions and pressure on price action. The drop is further limited by the stock's position below its 200-day moving average at $369.26, which signals enduring longer-term resistance.
 343.92
Highlights
- Intuit expanded AI-driven features across Credit Karma Tax, QuickBooks, and TurboTax, with real-time assistance and personalized planning tools.
- Recent company filings reported increased institutional share accumulation, strong free cash flow, stable dividends, and product growth in financial management.
- Shares of Intuit dropped 2.87% to $344.65 and currently trade in a $325.05 to $364.25 range, with technical indicators showing overbought conditions and buyers dominating near-term momentum.
AI product rollout and institutional holdings counter persistent selling
Intuit launched an AI-powered Credit Karma Tax service featuring real-time assistance, error checking, and personalized financial planning tools. The company expanded its AI-focused partnership with Aprio to deliver advanced advisory solutions for mid-market tax planning. AI agent implementation was broadened across Intuit's product suite, including QuickBooks and TurboTax, with recent filings reporting institutional share accumulation and robust free cash flow, stable dividends, and growth in financial management products, though price action has remained under broader selling pressure.
Uptrend signals supported by medium-term strength and overbought risk
Intuit is trading above its 20-day and 50-day moving averages at $302.75 and $321.38, yet remains capped below the 200-day moving average at $369.26. This alignment supports a positive trend in the short and medium term, contrasted by bearish technical resistance across the longer horizon. The stock currently faces resistance at $347.95 and support at $325.05. Momentum indicators such as the MACD and ADX reflect continued strength, but oscillators like the RSI, CCI, Stochastic RSI, and BBP highlight overbought conditions. The Awesome Oscillator points to additional buying interest, while the Hull Moving Average remains favorable. Despite these signals, intraday volatility reached 1.99%, with selling pressure intensifying after the open and the stock closing near its daily low as overbought risk persists.
Earlier, analysts noted that Intuit's strong momentum was tempered by increasing technical risks and the potential for near-term consolidation. This article adds a new dimension by highlighting persistent overbought technical signals and growing selling pressure, suggesting traders should watch for volatility around the $325.05 and $347.95 levels as the key indicators for breakout or breakdown in the coming sessions.










-
 Afghanistan
-
 Albania
-
 Algeria
-
 Angola
-
 Argentina
-
 Armenia
-
 Australia
-
 Austria
-
 Azerbaijan
-
 Bahamas
-
 Bahrain
-
 Bangladesh
-
 Belarus
-
 Belgium
-
 Bolivia
-
 Botswana
-
 Brazil
-
 Brunei
-
 Bulgaria
-
 Cambodia
-
 Cameroon
-
 Canada
-
 Chile
-
 China
-
 Colombia
-
 Congo
-
 Costa Rica
-
 Cote d'Ivoire
-
 Croatia
-
 Cuba
-
 Cyprus
-
 Czechia
-
 DR Congo
-
 Denmark
-
 Dominican Republic
-
 Ecuador
-
 Egypt
-
 El Salvador
-
 Estonia
-
 Eswatini
-
 Ethiopia
-
 Finland
-
 France
-
 Georgia
-
 Germany
-
 Ghana
-
 Greece
-
 Haiti
-
 Hong Kong
-
 Hungary
-
 India
-
 Indonesia
-
 Iran, Islamic republic
-
 Iraq
-
 Ireland
-
 Israel
-
 Italy
-
 Jamaica
-
 Japan
-
 Jordan
-
 Kazakhstan
-
 Kenya
-
 Korea
-
 Kuwait
-
 Kyrgyzstan
-
 Laos
-
 Latvia
-
 Lebanon
-
 Lesotho
-
 Libya
-
 Lithuania
-
 Luxembourg
-
 Madagascar
-
 Malaysia
-
 Malta
-
 Mauritius
-
 Mexico
-
 Moldova
-
 Mongolia
-
 Montenegro
-
 Morocco
-
 Mozambique
-
 Myanmar
-
 Namibia
-
 Nepal
-
 Netherlands
-
 New Zealand
-
 Nigeria
-
 North Macedonia
-
 Norway
-
 Oman
-
 Pakistan
-
 Palestine
-
 Panama
-
 Papua New Guinea
-
 Paraguay
-
 Peru
-
 Philippines
-
 Poland
-
 Portugal
-
 Puerto Rico
-
 Qatar
-
 Reunion
-
 Romania
-
 Rwanda
-
 Saudi Arabia
-
 Serbia
-
 Singapore
-
 Slovakia
-
 Slovenia
-
 Somalia
-
 South Africa
-
 Spain
-
 Sri Lanka
-
 Sweden
-
 Switzerland
-
 Syria
-
 Taiwan
-
 Tajikistan
-
 Tanzania
-
 Thailand
-
 Trinidad and Tobago
-
 Tunisia
-
 Turkey
-
 UAE
-
 Uganda
-
 Ukraine
-
 United Kingdom
-
United States
-
 Uruguay
-
 Uzbekistan
-
 Venezuela
-
 Vietnam
-
 Yemen
-
 Zambia
-
 Zimbabwe
- Forex
- Crypto












