

Procter & Gamble shares weekly forecast: Recovery holds but faces a stretched setup as consolidation persists

Shares of The Procter & Gamble Company (PG) are holding near $161 as recovery efforts continue for another week, but the setup is starting to look stretched. A steadier price has emerged after a recent rally driven by earnings, setting the stage for traders to watch whether this consolidation can persist or if a reversal looms.
 163.57
Highlights
- Shares of Procter & Gamble edged slightly lower to $160.66 over the past week but remain above key technical supports.
- The stock continues to hold a firm trend structure with volatility at 6.37% and indicators maintaining a bullish signal.
- The price is projected to consolidate in a $156.19 to $165.12 range with a 75% probability of an increase and a bullish breakout possible above $166.83.
Quarterly sales beat and guidance reaffirmation strengthen confidence in PG
Procter & Gamble reported its fiscal first quarter 2027 results on October 22, 2026, showing net sales grew 4% year-over-year to $23.3 billion and organic sales were up 4%, according to Procter & Gamble's official investor relations site. CNBC reported these quarterly numbers beat Wall Street's expectations, supported by strong demand in laundry and home care products and reinforcing confidence in the company's core businesses. PG also maintained its full-year guidance and announced a quarterly dividend of $1.09 per share to be paid on November 16, 2026 (source: Yahoo Finance).
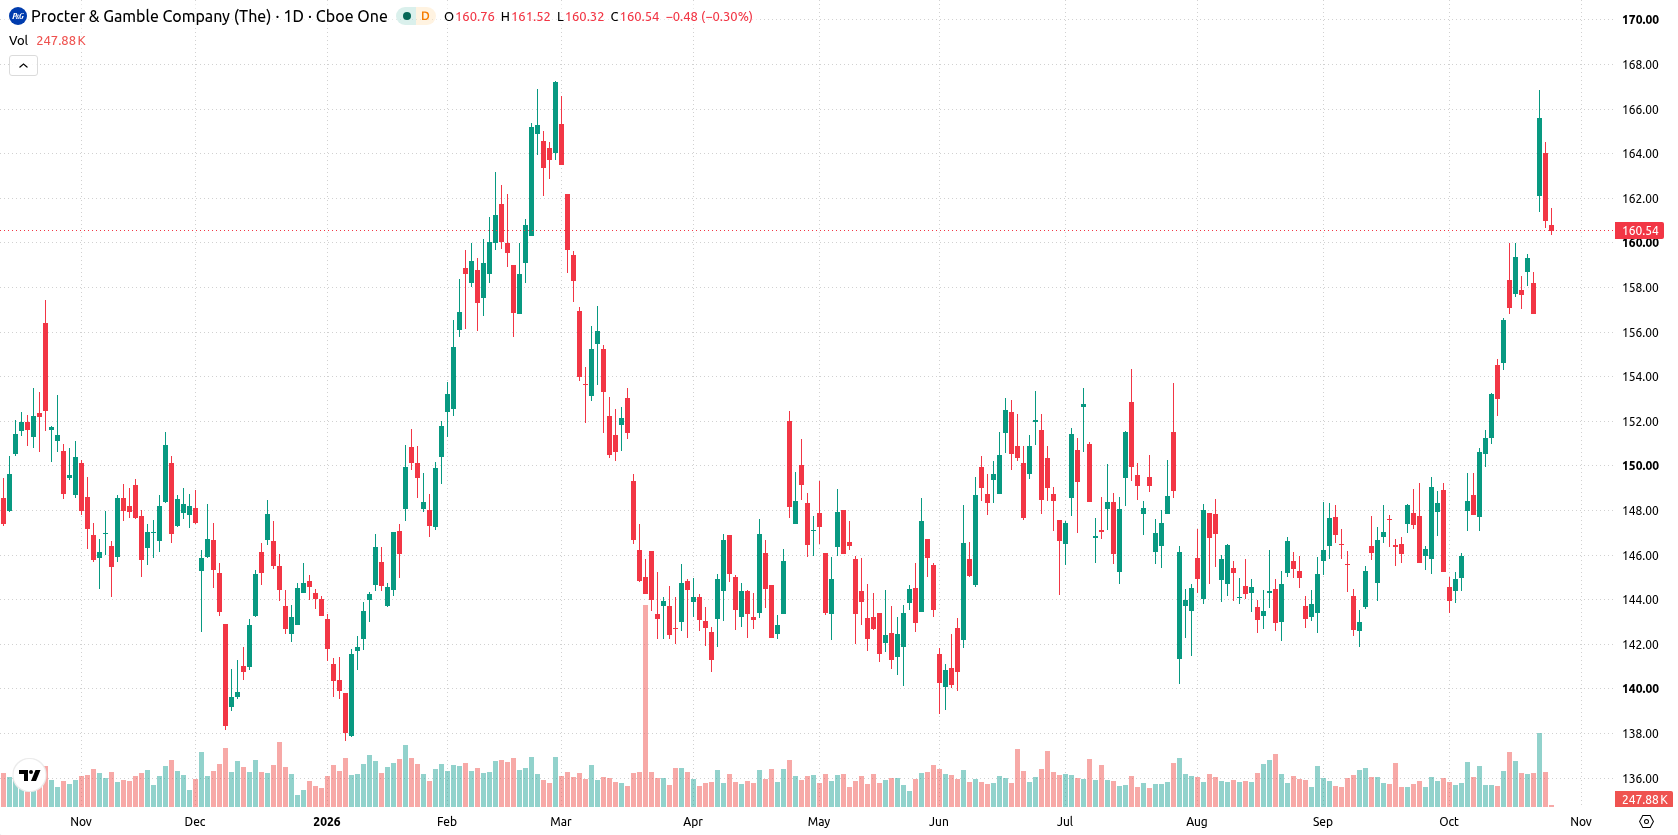
Overbought technicals reinforce bullish positioning as price holds above support
On the daily chart, the trend remains firm, with volatility over the last week at 6.37% and price holding well above the 20-day average, hinting at trend continuation. A sustained move lower with a firm trend is evident, as shown by CCI in the overbought zone at 116.67 while MACD continues to forecast a buy. The nearest support comes in at $156.84, reinforced by the Ichimoku Kijun at $155.12, while resistance is marked at $166.83, establishing clear levels for the next directional move.
Upside bias prevails next week while price tests range resistance
In the week ahead, the expected range for Procter & Gamble shares is $156.19 to $165.12. The probability of an increase is 75%, while the probability of a decrease is 25%. The base case points to continuation inside this range with price consolidating toward the upper bound. A bullish breakout above $166.83 would open the way for further gains, while a drop below $156.84 would likely trigger a deeper pullback.
Earlier, analysts noted that Procter & Gamble shares were displaying a divergence between persistent bullish technical signals and prevailing short-term selling pressure. With the current period of price consolidation now appearing extended, traders should monitor for a breakout above $166.83 or a decline below $156.84 as potential triggers for the next directional move.






Latest Procter & Gamble News





-
 Afghanistan
-
 Albania
-
 Algeria
-
 Angola
-
 Argentina
-
 Armenia
-
 Australia
-
 Austria
-
 Azerbaijan
-
 Bahamas
-
 Bahrain
-
 Bangladesh
-
 Belarus
-
 Belgium
-
 Bolivia
-
 Botswana
-
 Brazil
-
 Brunei
-
 Bulgaria
-
 Cambodia
-
 Cameroon
-
 Canada
-
 Chile
-
 China
-
 Colombia
-
 Congo
-
 Costa Rica
-
 Cote d'Ivoire
-
 Croatia
-
 Cuba
-
 Cyprus
-
 Czechia
-
 DR Congo
-
 Denmark
-
 Dominican Republic
-
 Ecuador
-
 Egypt
-
 El Salvador
-
 Estonia
-
 Eswatini
-
 Ethiopia
-
 Finland
-
 France
-
 Georgia
-
 Germany
-
 Ghana
-
 Greece
-
 Haiti
-
 Hong Kong
-
 Hungary
-
 India
-
 Indonesia
-
 Iran, Islamic republic
-
 Iraq
-
 Ireland
-
 Israel
-
 Italy
-
 Jamaica
-
 Japan
-
 Jordan
-
 Kazakhstan
-
 Kenya
-
 Korea
-
 Kuwait
-
 Kyrgyzstan
-
 Laos
-
 Latvia
-
 Lebanon
-
 Lesotho
-
 Libya
-
 Lithuania
-
 Luxembourg
-
 Madagascar
-
 Malaysia
-
 Malta
-
 Mauritius
-
 Mexico
-
 Moldova
-
 Mongolia
-
 Montenegro
-
 Morocco
-
 Mozambique
-
 Myanmar
-
 Namibia
-
 Nepal
-
 Netherlands
-
 New Zealand
-
 Nigeria
-
 North Macedonia
-
 Norway
-
 Oman
-
 Pakistan
-
 Palestine
-
 Panama
-
 Papua New Guinea
-
 Paraguay
-
 Peru
-
 Philippines
-
 Poland
-
 Portugal
-
 Puerto Rico
-
 Qatar
-
 Reunion
-
 Romania
-
 Rwanda
-
 Saudi Arabia
-
 Serbia
-
 Singapore
-
 Slovakia
-
 Slovenia
-
 Somalia
-
 South Africa
-
 Spain
-
 Sri Lanka
-
 Sweden
-
 Switzerland
-
 Syria
-
 Taiwan
-
 Tajikistan
-
 Tanzania
-
 Thailand
-
 Trinidad and Tobago
-
 Tunisia
-
 Turkey
-
 UAE
-
 Uganda
-
 Ukraine
-
 United Kingdom
-
United States
-
 Uruguay
-
 Uzbekistan
-
 Venezuela
-
 Vietnam
-
 Yemen
-
 Zambia
-
 Zimbabwe
- Forex
- Crypto












