

ABX trades flat as consolidation and weak momentum dominate near C$54.89 resistance

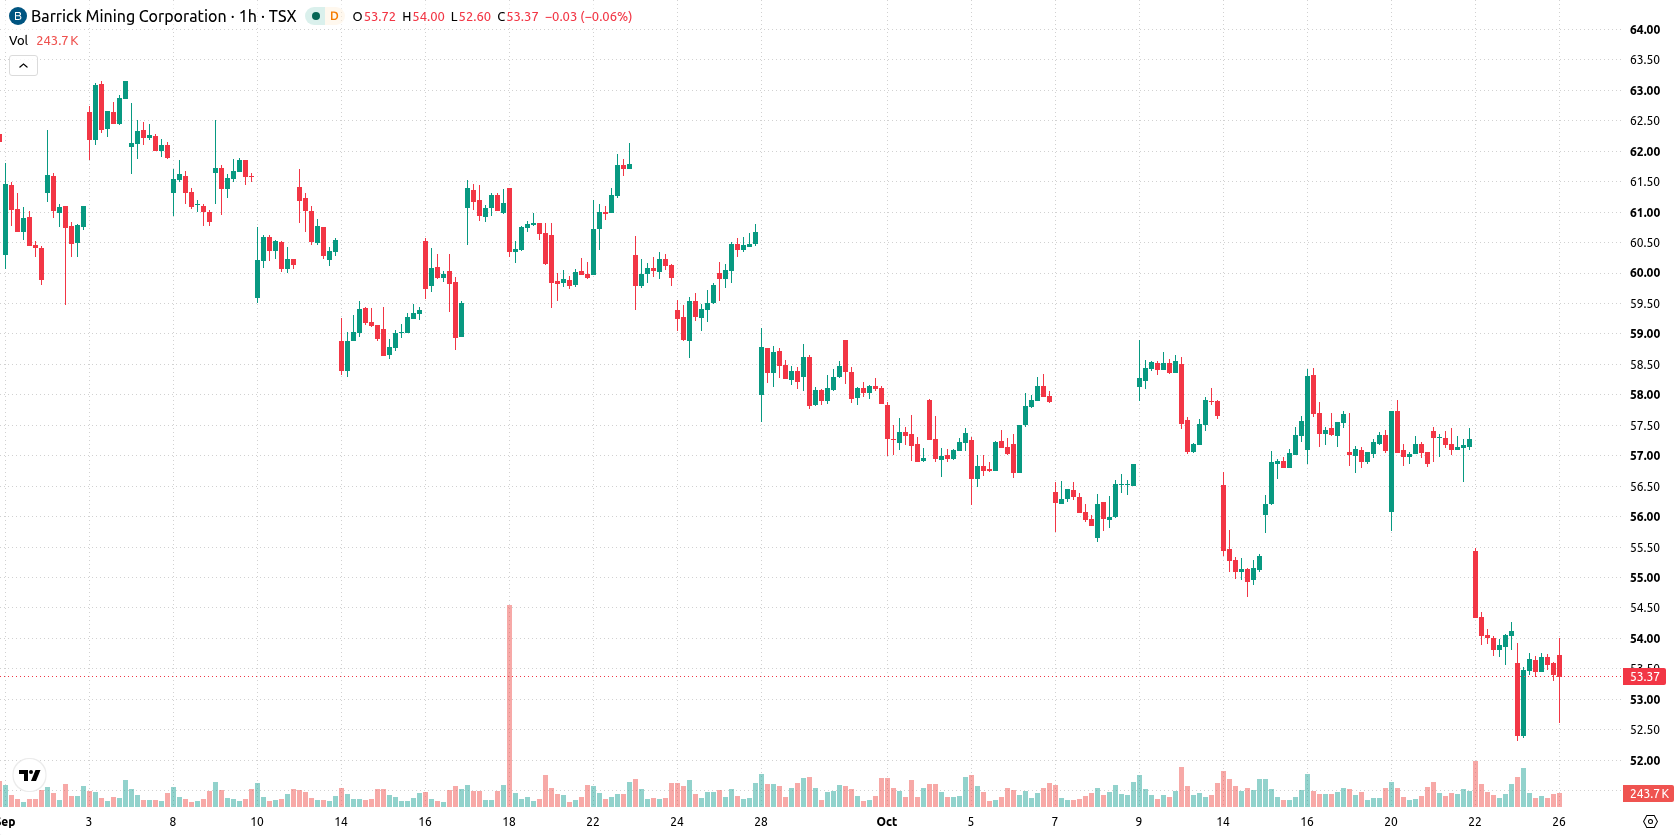
Barrick Gold (ABX) stock is trading at C$53.69, posting a modest gain for the session. The price remains below its key moving averages, showing continued weakness relative to short, medium, and long-term moving average levels.
 54.37
60.46
Highlights
- ABX/CAD trades below key moving averages on all timeframes, indicating continuing downward pressure from sellers.
- Bearish technical momentum persists with most indicators on Sell or Oversold, despite a modest intraday price uptick to C$53.69.
- ABX/CAD is expected to remain in the C$51.22 to C$56.16 range over the next two to three sessions, with downside risks classified as very high.
Bearish signals strengthen as support fails and momentum weakens
On the hourly chart, ABX is trading below the MA-20 at C$54.53, MA-50 at C$56.14, and the long-term MA-200 at C$58.91. Immediate resistance is established by the Ichimoku Kijun at C$54.89. MACD and ADX both show Sell signals, while RSI reads 31.44 and CCI also indicates Sell; Bull/Bear Power is at oversold levels. Stoch RSI and Awesome Oscillator are neutral, reflecting some hesitation but overall confirming bearish intraday sentiment.
Downside risk intensifies as upside remains capped by resistance
In the next two to three trading days, ABX is likely to remain confined within the C$51.22 to C$56.16 volatility band. Upside probability remains very low given current technical pressures, while downside risk is high and a reversal is unlikely. The base case expects continued sideways movement, but a bullish scenario requires a break above the Kijun resistance, while further weakness could extend to the lower end of the recent range.
Earlier, analysts noted that persistent selling kept Barrick Gold stock under pressure despite positive company developments, maintaining a bearish technical outlook. The current analysis reaffirms this downside bias, with continued weakness suggesting traders should monitor the C$54.89 Ichimoku Kijun resistance for any potential shift in direction.






Latest Barrick Gold News




-
 Afghanistan
-
 Albania
-
 Algeria
-
 Angola
-
 Argentina
-
 Armenia
-
 Australia
-
 Austria
-
 Azerbaijan
-
 Bahamas
-
 Bahrain
-
 Bangladesh
-
 Belarus
-
 Belgium
-
 Bolivia
-
 Botswana
-
 Brazil
-
 Brunei
-
 Bulgaria
-
 Cambodia
-
 Cameroon
-
 Canada
-
 Chile
-
 China
-
 Colombia
-
 Congo
-
 Costa Rica
-
 Cote d'Ivoire
-
 Croatia
-
 Cuba
-
 Cyprus
-
 Czechia
-
 DR Congo
-
 Denmark
-
 Dominican Republic
-
 Ecuador
-
 Egypt
-
 El Salvador
-
 Estonia
-
 Eswatini
-
 Ethiopia
-
 Finland
-
 France
-
 Georgia
-
 Germany
-
 Ghana
-
 Greece
-
 Haiti
-
 Hong Kong
-
 Hungary
-
 India
-
 Indonesia
-
 Iran, Islamic republic
-
 Iraq
-
 Ireland
-
 Israel
-
 Italy
-
 Jamaica
-
 Japan
-
 Jordan
-
 Kazakhstan
-
 Kenya
-
 Korea
-
 Kuwait
-
 Kyrgyzstan
-
 Laos
-
 Latvia
-
 Lebanon
-
 Lesotho
-
 Libya
-
 Lithuania
-
 Luxembourg
-
 Madagascar
-
 Malaysia
-
 Malta
-
 Mauritius
-
 Mexico
-
 Moldova
-
 Mongolia
-
 Montenegro
-
 Morocco
-
 Mozambique
-
 Myanmar
-
 Namibia
-
 Nepal
-
 Netherlands
-
 New Zealand
-
 Nigeria
-
 North Macedonia
-
 Norway
-
 Oman
-
 Pakistan
-
 Palestine
-
 Panama
-
 Papua New Guinea
-
 Paraguay
-
 Peru
-
 Philippines
-
 Poland
-
 Portugal
-
 Puerto Rico
-
 Qatar
-
 Reunion
-
 Romania
-
 Rwanda
-
 Saudi Arabia
-
 Serbia
-
 Singapore
-
 Slovakia
-
 Slovenia
-
 Somalia
-
 South Africa
-
 Spain
-
 Sri Lanka
-
 Sweden
-
 Switzerland
-
 Syria
-
 Taiwan
-
 Tajikistan
-
 Tanzania
-
 Thailand
-
 Trinidad and Tobago
-
 Tunisia
-
 Turkey
-
 UAE
-
 Uganda
-
 Ukraine
-
 United Kingdom
-
United States
-
 Uruguay
-
 Uzbekistan
-
 Venezuela
-
 Vietnam
-
 Yemen
-
 Zambia
-
 Zimbabwe
- Forex
- Crypto












