

Will Hut 8 stock extend gains amid mixed signals and key resistance overhead?

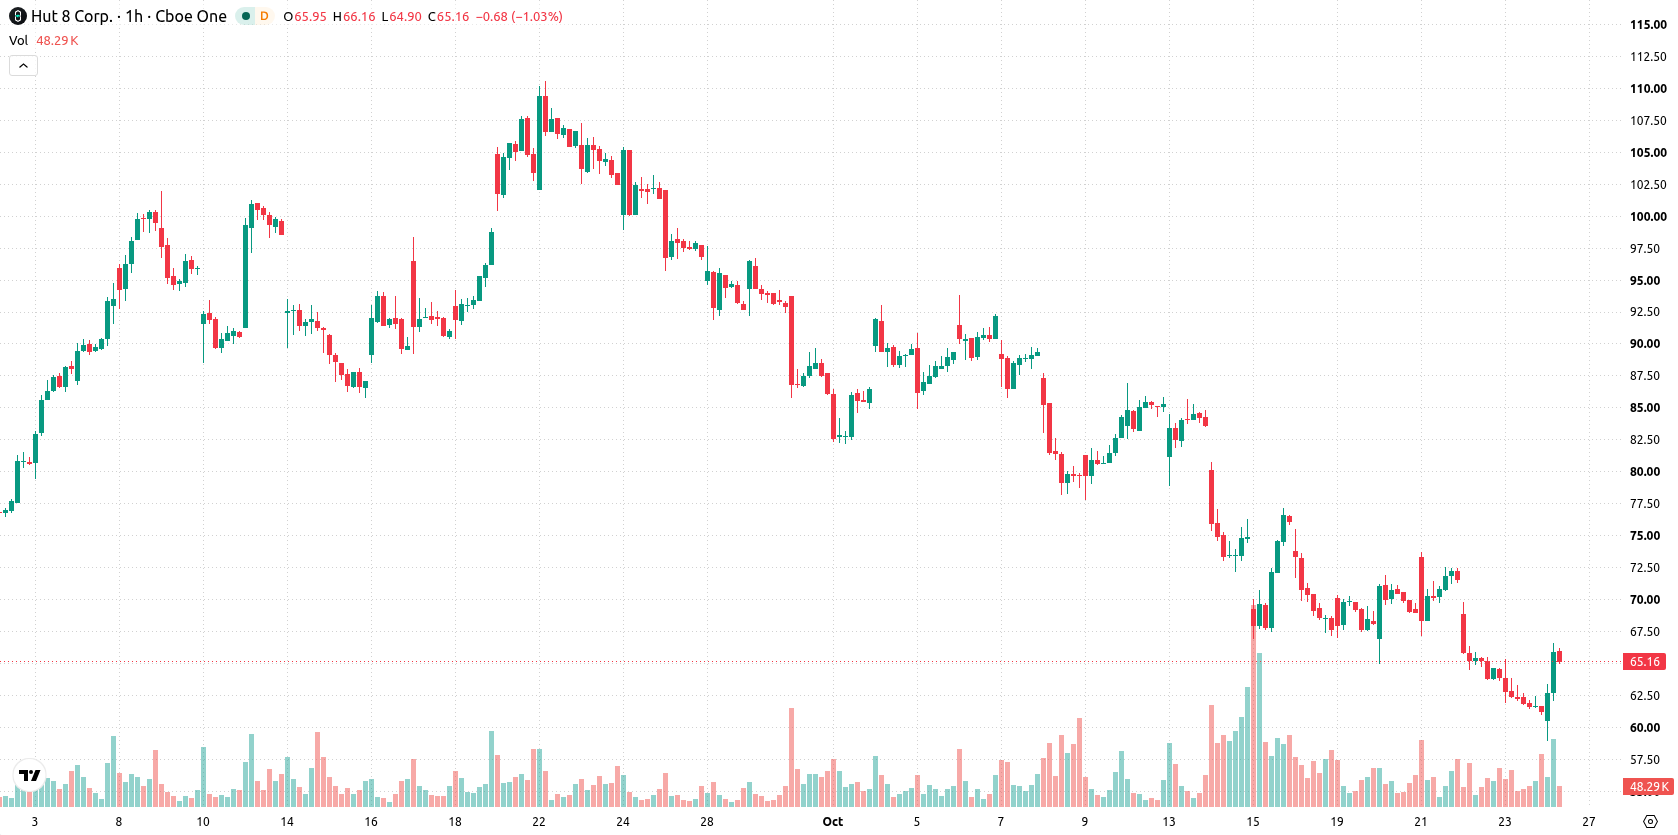
Hut 8 (HUT) stock is trading at $65.19, up 6.4% on the day. The price is currently above its key short-term moving average, while remaining below mid- and long-term average levels.
 53.43
64.59
Highlights
- HUT/USD shows short-term gains above the 20-day moving average but remains under medium- and long-term moving averages.
- Momentum indicators are mixed, with MACD and ADX showing strong sell signals and intraday oscillators overbought.
- Price is expected to consolidate between $59.69 and $70.69, with a 65% probability of a downward move.
Mixed technical momentum as buyers challenge broader downtrend
On the technical front, HUT/USD is above the MA-20 at $64.87, but remains under both the MA-50 ($68.07) and the MA-200 ($82.37). The Ichimoku Kijun at $66.25 is acting as immediate resistance. MACD and ADX both point to ongoing sell pressure, whereas RSI at 50.51 provides a moderate buy reading. Stochastic RSI and Bull/Bear Power indicate overbought conditions, and CCI reads neutral. This creates a technical backdrop of mixed signals, with buyers currently dominating intraday momentum but broader trends showing divergence.
Downside favored as price consolidates within defined range
Over the next several days, HUT is expected to consolidate within the $59.69 to $70.69 price range, according to typical volatility. The probability of a move higher stands at 35%, with a 65% chance of a move lower, making a reversal less likely. A breakout above $66.25 could support renewed recovery, while a drop below $59.69 would likely accelerate selling pressure.
Earlier, analysts noted that Hut 8 faced continued downside risk due to persistent bearish momentum and resistance at key technical levels. The latest price action introduces mixed technical signals, and traders should closely monitor the $66.25 resistance as a potential pivot for any sustained recovery attempt.











-
 Afghanistan
-
 Albania
-
 Algeria
-
 Angola
-
 Argentina
-
 Armenia
-
 Australia
-
 Austria
-
 Azerbaijan
-
 Bahamas
-
 Bahrain
-
 Bangladesh
-
 Belarus
-
 Belgium
-
 Bolivia
-
 Botswana
-
 Brazil
-
 Brunei
-
 Bulgaria
-
 Cambodia
-
 Cameroon
-
 Canada
-
 Chile
-
 China
-
 Colombia
-
 Congo
-
 Costa Rica
-
 Cote d'Ivoire
-
 Croatia
-
 Cuba
-
 Cyprus
-
 Czechia
-
 DR Congo
-
 Denmark
-
 Dominican Republic
-
 Ecuador
-
 Egypt
-
 El Salvador
-
 Estonia
-
 Eswatini
-
 Ethiopia
-
 Finland
-
 France
-
 Georgia
-
 Germany
-
 Ghana
-
 Greece
-
 Haiti
-
 Hong Kong
-
 Hungary
-
 India
-
 Indonesia
-
 Iran, Islamic republic
-
 Iraq
-
 Ireland
-
 Israel
-
 Italy
-
 Jamaica
-
 Japan
-
 Jordan
-
 Kazakhstan
-
 Kenya
-
 Korea
-
 Kuwait
-
 Kyrgyzstan
-
 Laos
-
 Latvia
-
 Lebanon
-
 Lesotho
-
 Libya
-
 Lithuania
-
 Luxembourg
-
 Madagascar
-
 Malaysia
-
 Malta
-
 Mauritius
-
 Mexico
-
 Moldova
-
 Mongolia
-
 Montenegro
-
 Morocco
-
 Mozambique
-
 Myanmar
-
 Namibia
-
 Nepal
-
 Netherlands
-
 New Zealand
-
 Nigeria
-
 North Macedonia
-
 Norway
-
 Oman
-
 Pakistan
-
 Palestine
-
 Panama
-
 Papua New Guinea
-
 Paraguay
-
 Peru
-
 Philippines
-
 Poland
-
 Portugal
-
 Puerto Rico
-
 Qatar
-
 Reunion
-
 Romania
-
 Rwanda
-
 Saudi Arabia
-
 Serbia
-
 Singapore
-
 Slovakia
-
 Slovenia
-
 Somalia
-
 South Africa
-
 Spain
-
 Sri Lanka
-
 Sweden
-
 Switzerland
-
 Syria
-
 Taiwan
-
 Tajikistan
-
 Tanzania
-
 Thailand
-
 Trinidad and Tobago
-
 Tunisia
-
 Turkey
-
 UAE
-
 Uganda
-
 Ukraine
-
 United Kingdom
-
United States
-
 Uruguay
-
 Uzbekistan
-
 Venezuela
-
 Vietnam
-
 Yemen
-
 Zambia
-
 Zimbabwe
- Forex
- Crypto












