

McDonald's stock holds firm uptrend amid rising volatility: weekly analysis

Shares of McDonald's Corporation (MCD) are trading near $249 as a week of consolidation leaves the rally running into overbought technical signals. While the uptrend remains firm, momentum is showing some signs of exhaustion, setting up a potential pause or short-term correction as traders look for fresh drivers in the days ahead.
 275.65
283.49
Highlights
- Shares of McDonalds are trading at $248.88, showing a modest gain of $0.39 over the past 7 days.
- The stock is currently consolidating just below key resistance with long-term trends remaining bearish and daily momentum firm.
- A trading range of $244.72 to $253.03 is expected for the week, with volatility elevated and indicators signaling short-term overbought conditions.
Legal pushback and franchise shift shape sentiment ahead of earnings and fund flows
McDonald's has formally objected to tokenized trading of its shares on the planned OKXICE platform, making use of a new Securities and Exchange Commission exemption, according to Yahoo Finance. The company is scheduled to report its third-quarter 2026 earnings on November 4, with consensus calling for a year-over-year increase in adjusted earnings per share. Meanwhile, recent filings show Valley National Advisers Inc. increased its MCD holding by more than 140% in the third quarter, while management reiterated plans to shift toward a franchise-heavy model by 2028.
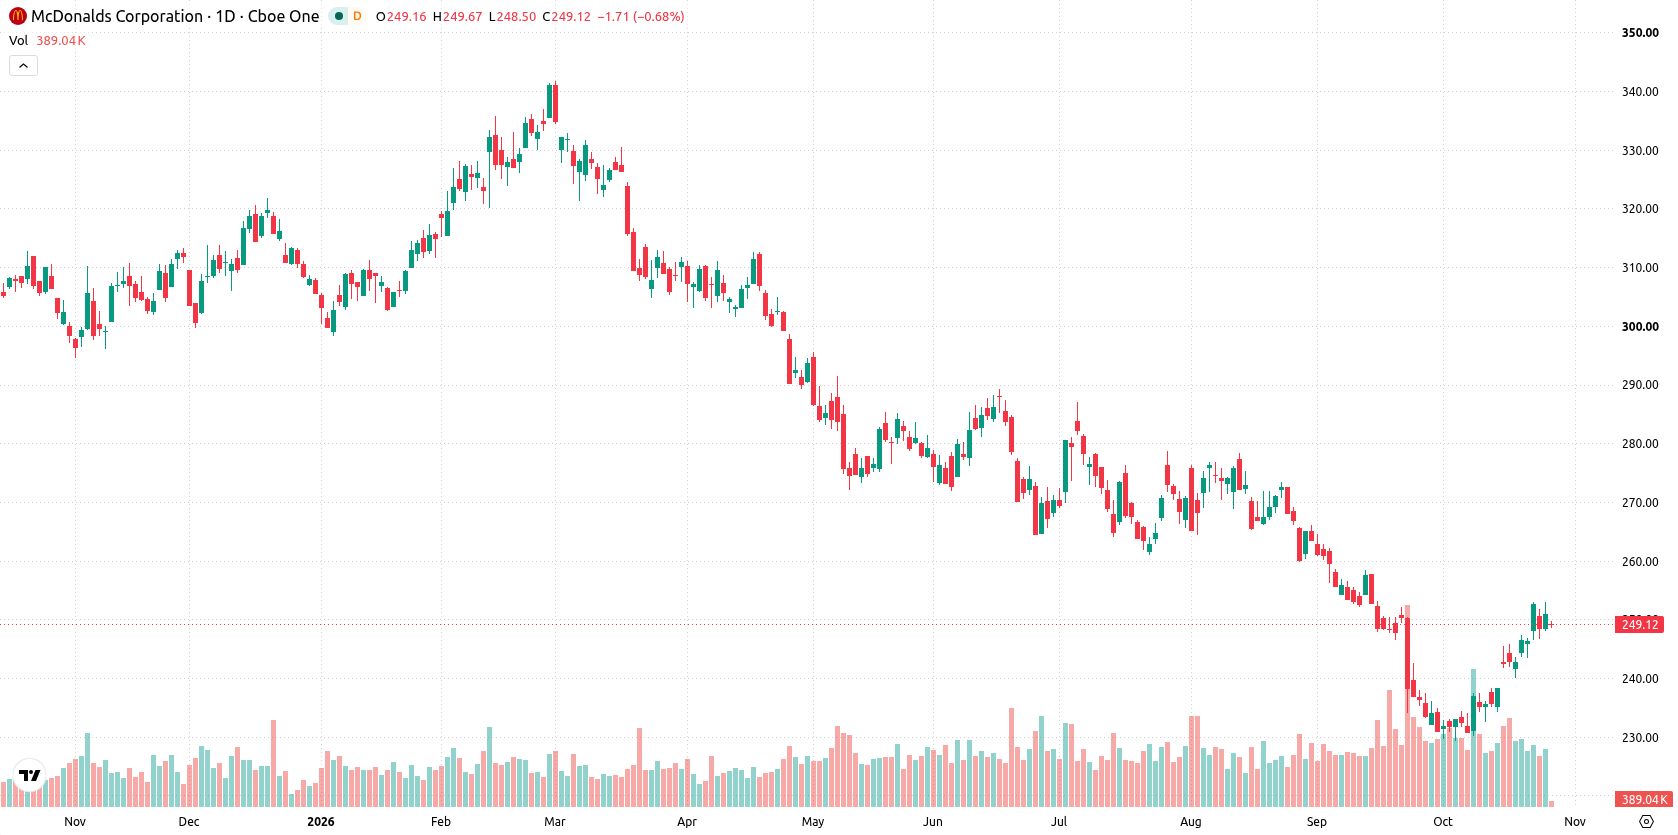
Correction risks rise as technicals flash overbought despite firm weekly trend
On the daily chart, the stock is showing a sustained move higher with a firm trend, as supported by a 3.82% rise in volatility. CCI and Stochastic RSI both register overbought, suggesting potential for short-term correction risk, while the ADX points to continued buying. Immediate support is at $243.54, with resistance at $249.36—both levels aligning with the weekly low and MA-50 respectively. Ichimoku Kijun at $241.07 provides an additional layer of support if the trend falters.
Breakout potential builds as consolidation persists between key weekly levels
Over the coming trading week, the stock is expected to trade within a range of $244.72 to $253.03. There is a 60% probability of an increase and a 40% probability of a decrease. The base case sees price continuing to consolidate between $243.54 support and $249.36 resistance. A decisive break above resistance could open a move toward the top end of the expected range at $253.03, while a drop below support would risk a retreat toward the $241.07 area.
Earlier, analysts noted that McDonald's was experiencing persistent selling pressure and mixed technical momentum despite achieving 'Dividend King' status. The current analysis adds a new dimension by highlighting ongoing consolidation near key resistance, with traders advised to monitor a potential breakout above $249.36 or a pullback below $243.54 for directional cues.










-
 Afghanistan
-
 Albania
-
 Algeria
-
 Angola
-
 Argentina
-
 Armenia
-
 Australia
-
 Austria
-
 Azerbaijan
-
 Bahamas
-
 Bahrain
-
 Bangladesh
-
 Belarus
-
 Belgium
-
 Bolivia
-
 Botswana
-
 Brazil
-
 Brunei
-
 Bulgaria
-
 Cambodia
-
 Cameroon
-
 Canada
-
 Chile
-
 China
-
 Colombia
-
 Congo
-
 Costa Rica
-
 Cote d'Ivoire
-
 Croatia
-
 Cuba
-
 Cyprus
-
 Czechia
-
 DR Congo
-
 Denmark
-
 Dominican Republic
-
 Ecuador
-
 Egypt
-
 El Salvador
-
 Estonia
-
 Eswatini
-
 Ethiopia
-
 Finland
-
 France
-
 Georgia
-
 Germany
-
 Ghana
-
 Greece
-
 Haiti
-
 Hong Kong
-
 Hungary
-
 India
-
 Indonesia
-
 Iran, Islamic republic
-
 Iraq
-
 Ireland
-
 Israel
-
 Italy
-
 Jamaica
-
 Japan
-
 Jordan
-
 Kazakhstan
-
 Kenya
-
 Korea
-
 Kuwait
-
 Kyrgyzstan
-
 Laos
-
 Latvia
-
 Lebanon
-
 Lesotho
-
 Libya
-
 Lithuania
-
 Luxembourg
-
 Madagascar
-
 Malaysia
-
 Malta
-
 Mauritius
-
 Mexico
-
 Moldova
-
 Mongolia
-
 Montenegro
-
 Morocco
-
 Mozambique
-
 Myanmar
-
 Namibia
-
 Nepal
-
 Netherlands
-
 New Zealand
-
 Nigeria
-
 North Macedonia
-
 Norway
-
 Oman
-
 Pakistan
-
 Palestine
-
 Panama
-
 Papua New Guinea
-
 Paraguay
-
 Peru
-
 Philippines
-
 Poland
-
 Portugal
-
 Puerto Rico
-
 Qatar
-
 Reunion
-
 Romania
-
 Rwanda
-
 Saudi Arabia
-
 Serbia
-
 Singapore
-
 Slovakia
-
 Slovenia
-
 Somalia
-
 South Africa
-
 Spain
-
 Sri Lanka
-
 Sweden
-
 Switzerland
-
 Syria
-
 Taiwan
-
 Tajikistan
-
 Tanzania
-
 Thailand
-
 Trinidad and Tobago
-
 Tunisia
-
 Turkey
-
 UAE
-
 Uganda
-
 Ukraine
-
 United Kingdom
-
United States
-
 Uruguay
-
 Uzbekistan
-
 Venezuela
-
 Vietnam
-
 Yemen
-
 Zambia
-
 Zimbabwe
- Forex
- Crypto












