

AMD stock rises as overbought conditions limit upside potential

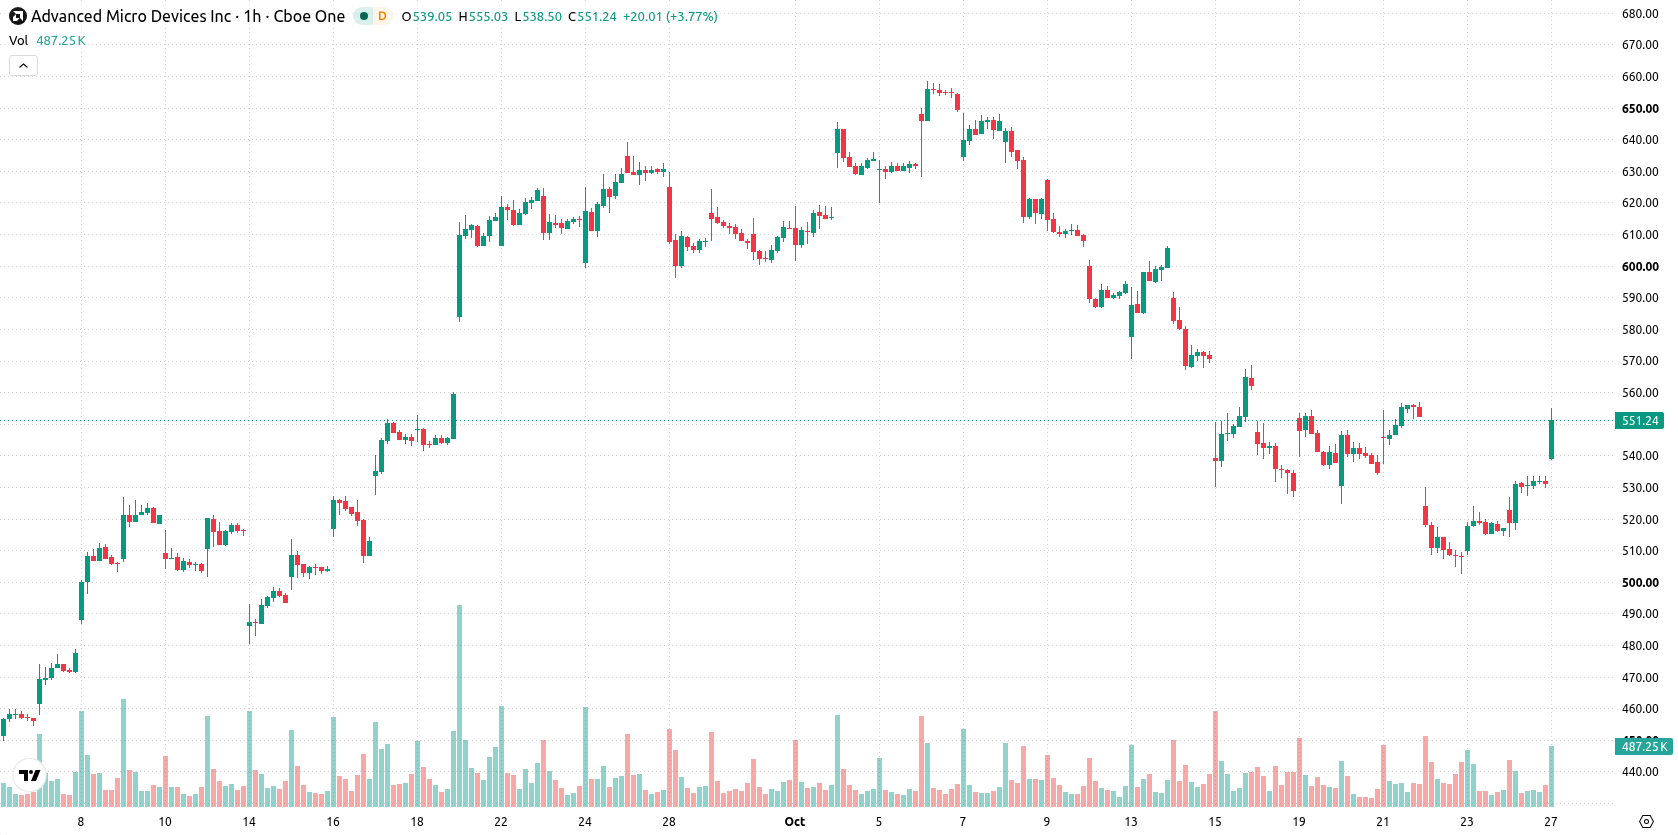
Advanced Micro Devices (AMD) stock is trading at $548.08, marking a 3.07% gain for the day. The price currently sits above its key short- and medium-term moving averages, as well as comfortably over long-term markers.
 559.18
593.63
Highlights
- Shares of AMD trade in a bullish pattern across short, medium, and long term timeframes, with price up 3.07% intraday after recovering from an 8.71 gap down.
- Key support holds at $529.69 with a projected near-term range of $523.87 to $572.29, setting defined technical boundaries.
- Indicators are mixed as buyers control intraday momentum and many oscillators are overbought, with a 55% probability of a downward move and 45% for an advance.
Overbought readings and mixed momentum constrain further gains
On the technical front, AMD is trading above the MA-20 and MA-50 on the hourly chart and remains significantly above the MA-200 on the daily chart. The Ichimoku Kijun on the daily timeframe sits at $529.69, acting as an immediate support. Momentum signals are mixed: the MACD shows strong selling pressure while the ADX is neutral. RSI is in a buy zone, but both Stoch RSI and CCI are in overbought territory, as is Bull/Bear Power, indicating strong buyer dominance. The Awesome Oscillator reflects robust buying, mirroring current intraday sentiment. Nonetheless, divergence among these oscillators suggests that while buyers dominate now, overbought conditions could temper further upside.
Range-bound outlook as volatility steers risk profile
Over the coming days, AMD is expected to trade within a range of $523.87 to $572.29 based on recent volatility. The probability of a downward move stands at 55%, while the chance of further upside is 45%. The baseline expectation is for consolidation within this band. A move above $572.29 could signal renewed bullish momentum, while a drop below $523.87 would open the door to short-term downside.
Earlier, analysts noted that AMD stood out from sector volatility due to its strong fundamentals and relative resilience despite broader weakness in AI-linked equities. With mixed momentum signals and current price action suggesting a consolidation phase, a break above $572.29 or below $523.87 will be critical for traders seeking directional cues in the near term.











-
 Afghanistan
-
 Albania
-
 Algeria
-
 Angola
-
 Argentina
-
 Armenia
-
 Australia
-
 Austria
-
 Azerbaijan
-
 Bahamas
-
 Bahrain
-
 Bangladesh
-
 Belarus
-
 Belgium
-
 Bolivia
-
 Botswana
-
 Brazil
-
 Brunei
-
 Bulgaria
-
 Cambodia
-
 Cameroon
-
 Canada
-
 Chile
-
 China
-
 Colombia
-
 Congo
-
 Costa Rica
-
 Cote d'Ivoire
-
 Croatia
-
 Cuba
-
 Cyprus
-
 Czechia
-
 DR Congo
-
 Denmark
-
 Dominican Republic
-
 Ecuador
-
 Egypt
-
 El Salvador
-
 Estonia
-
 Eswatini
-
 Ethiopia
-
 Finland
-
 France
-
 Georgia
-
 Germany
-
 Ghana
-
 Greece
-
 Haiti
-
 Hong Kong
-
 Hungary
-
 India
-
 Indonesia
-
 Iran, Islamic republic
-
 Iraq
-
 Ireland
-
 Israel
-
 Italy
-
 Jamaica
-
 Japan
-
 Jordan
-
 Kazakhstan
-
 Kenya
-
 Korea
-
 Kuwait
-
 Kyrgyzstan
-
 Laos
-
 Latvia
-
 Lebanon
-
 Lesotho
-
 Libya
-
 Lithuania
-
 Luxembourg
-
 Madagascar
-
 Malaysia
-
 Malta
-
 Mauritius
-
 Mexico
-
 Moldova
-
 Mongolia
-
 Montenegro
-
 Morocco
-
 Mozambique
-
 Myanmar
-
 Namibia
-
 Nepal
-
 Netherlands
-
 New Zealand
-
 Nigeria
-
 North Macedonia
-
 Norway
-
 Oman
-
 Pakistan
-
 Palestine
-
 Panama
-
 Papua New Guinea
-
 Paraguay
-
 Peru
-
 Philippines
-
 Poland
-
 Portugal
-
 Puerto Rico
-
 Qatar
-
 Reunion
-
 Romania
-
 Rwanda
-
 Saudi Arabia
-
 Serbia
-
 Singapore
-
 Slovakia
-
 Slovenia
-
 Somalia
-
 South Africa
-
 Spain
-
 Sri Lanka
-
 Sweden
-
 Switzerland
-
 Syria
-
 Taiwan
-
 Tajikistan
-
 Tanzania
-
 Thailand
-
 Trinidad and Tobago
-
 Tunisia
-
 Turkey
-
 UAE
-
 Uganda
-
 Ukraine
-
 United Kingdom
-
United States
-
 Uruguay
-
 Uzbekistan
-
 Venezuela
-
 Vietnam
-
 Yemen
-
 Zambia
-
 Zimbabwe
- Forex
- Crypto












