

What's behind Flex's latest 5.9% stock surge?

Flex Ltd (FLEX) surged 5.86% on the day, driven by anticipation surrounding its upcoming second-quarter fiscal 2027 earnings release, which is expected to show year-over-year growth in both earnings and revenue. The rebound looks limited, with Flex trading well below all major moving averages and negative technical momentum still dominating.
 95.22
95.22
Highlights
- Flex Ltd is expected to report year-on-year growth in both earnings and revenue in its second-quarter fiscal 2027 results.
- Recent institutional flows include Nisa Investment Advisors LLC cutting its stake by 43.5% and Deltec Asset Management LLC raising its position by 40.3%.
- Shares of Flex trade below key moving averages with strong oversold signals, expected to fluctuate between $73.11 and $89.89 over the next five trading days.
Shifting fund positions and upbeat forecasts ahead of results
Flex Ltd is scheduled to release its second-quarter fiscal 2027 results before the market opens on October 28, with consensus pointing to annual increases in both earnings and revenue. In the third quarter, Nisa Investment Advisors LLC reduced its stake in the company by 43.5%, while Deltec Asset Management LLC increased its position by 40.3%. Flex, previously known as Flextronics, continues to focus on providing manufacturing solutions worldwide.
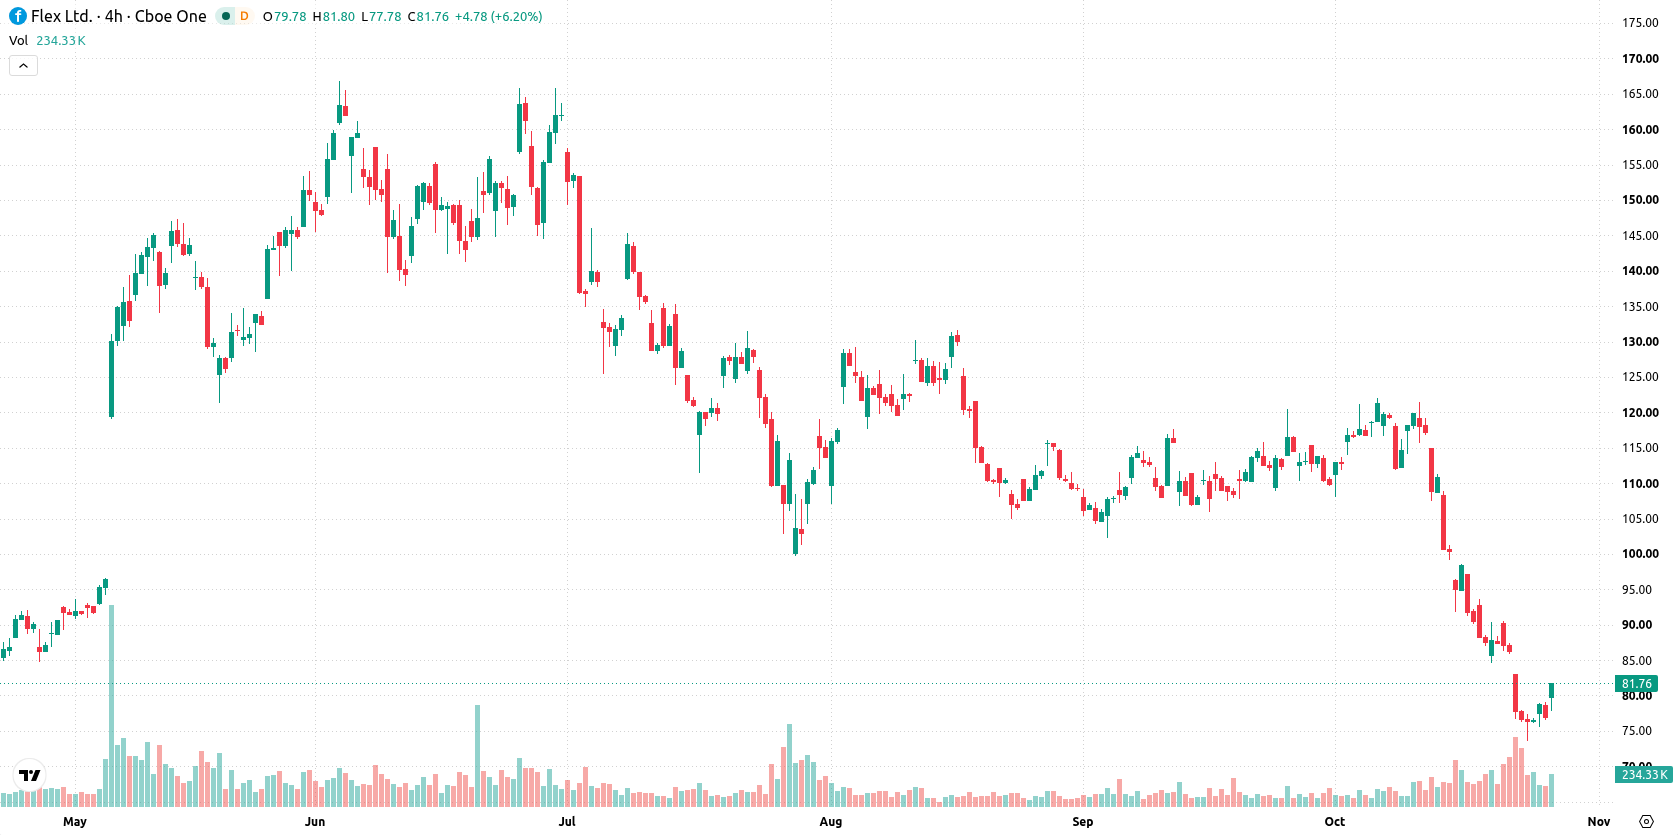
Intraday surge defies entrenched bearish momentum and oversold indicators
Flex is trading well below all major moving averages, with the current price at $81.5 compared to the MA-20 at $102.72, MA-50 at $108.05, and MA-200 at $102.6. This setup points to persistent downtrend pressure across the short, medium, and long term, with the Ichimoku Kijun at $97.71 providing further confirmation. The immediate trading range is capped by the near-term ceiling at $81.67 and supported by the near-term floor at $77.75. Momentum indicators remain firmly negative overall. The Relative Strength Index (RSI) is deeply oversold at 22.92, and Stochastic RSI and Commodity Channel Index (CCI) confirm strong oversold conditions. MACD and Average Directional Index (ADX) both forecast continued selling momentum. Bull/Bear Power (BBP) at -12.5 shows sellers dominating intraday moves, flagged as oversold. The Awesome Oscillator is also in sell mode, supporting the prevailing negative trend. Despite these weak signals, the stock is up $4.51 or 5.86% on the day after an upside gap of 3.38% ($2.6), currently trading near its high. Intraday volatility stands at 5.04%. There is evident strength toward session highs, which is at odds with the strongly bearish readings across momentum and oscillators.
Previously it was reported that Flex faced sustained bearish momentum following the completion of its EPC Power acquisition, with technical indicators highlighting persistent downside pressure. The current rebound, despite oversold conditions and a single-session surge, reinforces the ongoing risk of further declines if support below $77.75 fails to hold in the coming sessions.










-
 Afghanistan
-
 Albania
-
 Algeria
-
 Angola
-
 Argentina
-
 Armenia
-
 Australia
-
 Austria
-
 Azerbaijan
-
 Bahamas
-
 Bahrain
-
 Bangladesh
-
 Belarus
-
 Belgium
-
 Bolivia
-
 Botswana
-
 Brazil
-
 Brunei
-
 Bulgaria
-
 Cambodia
-
 Cameroon
-
 Canada
-
 Chile
-
 China
-
 Colombia
-
 Congo
-
 Costa Rica
-
 Cote d'Ivoire
-
 Croatia
-
 Cuba
-
 Cyprus
-
 Czechia
-
 DR Congo
-
 Denmark
-
 Dominican Republic
-
 Ecuador
-
 Egypt
-
 El Salvador
-
 Estonia
-
 Eswatini
-
 Ethiopia
-
 Finland
-
 France
-
 Georgia
-
 Germany
-
 Ghana
-
 Greece
-
 Haiti
-
 Hong Kong
-
 Hungary
-
 India
-
 Indonesia
-
 Iran, Islamic republic
-
 Iraq
-
 Ireland
-
 Israel
-
 Italy
-
 Jamaica
-
 Japan
-
 Jordan
-
 Kazakhstan
-
 Kenya
-
 Korea
-
 Kuwait
-
 Kyrgyzstan
-
 Laos
-
 Latvia
-
 Lebanon
-
 Lesotho
-
 Libya
-
 Lithuania
-
 Luxembourg
-
 Madagascar
-
 Malaysia
-
 Malta
-
 Mauritius
-
 Mexico
-
 Moldova
-
 Mongolia
-
 Montenegro
-
 Morocco
-
 Mozambique
-
 Myanmar
-
 Namibia
-
 Nepal
-
 Netherlands
-
 New Zealand
-
 Nigeria
-
 North Macedonia
-
 Norway
-
 Oman
-
 Pakistan
-
 Palestine
-
 Panama
-
 Papua New Guinea
-
 Paraguay
-
 Peru
-
 Philippines
-
 Poland
-
 Portugal
-
 Puerto Rico
-
 Qatar
-
 Reunion
-
 Romania
-
 Rwanda
-
 Saudi Arabia
-
 Serbia
-
 Singapore
-
 Slovakia
-
 Slovenia
-
 Somalia
-
 South Africa
-
 Spain
-
 Sri Lanka
-
 Sweden
-
 Switzerland
-
 Syria
-
 Taiwan
-
 Tajikistan
-
 Tanzania
-
 Thailand
-
 Trinidad and Tobago
-
 Tunisia
-
 Turkey
-
 UAE
-
 Uganda
-
 Ukraine
-
 United Kingdom
-
United States
-
 Uruguay
-
 Uzbekistan
-
 Venezuela
-
 Vietnam
-
 Yemen
-
 Zambia
-
 Zimbabwe
- Forex
- Crypto












