

Caterpillar shares technical analysis: Upward price move persists despite bearish momentum signals

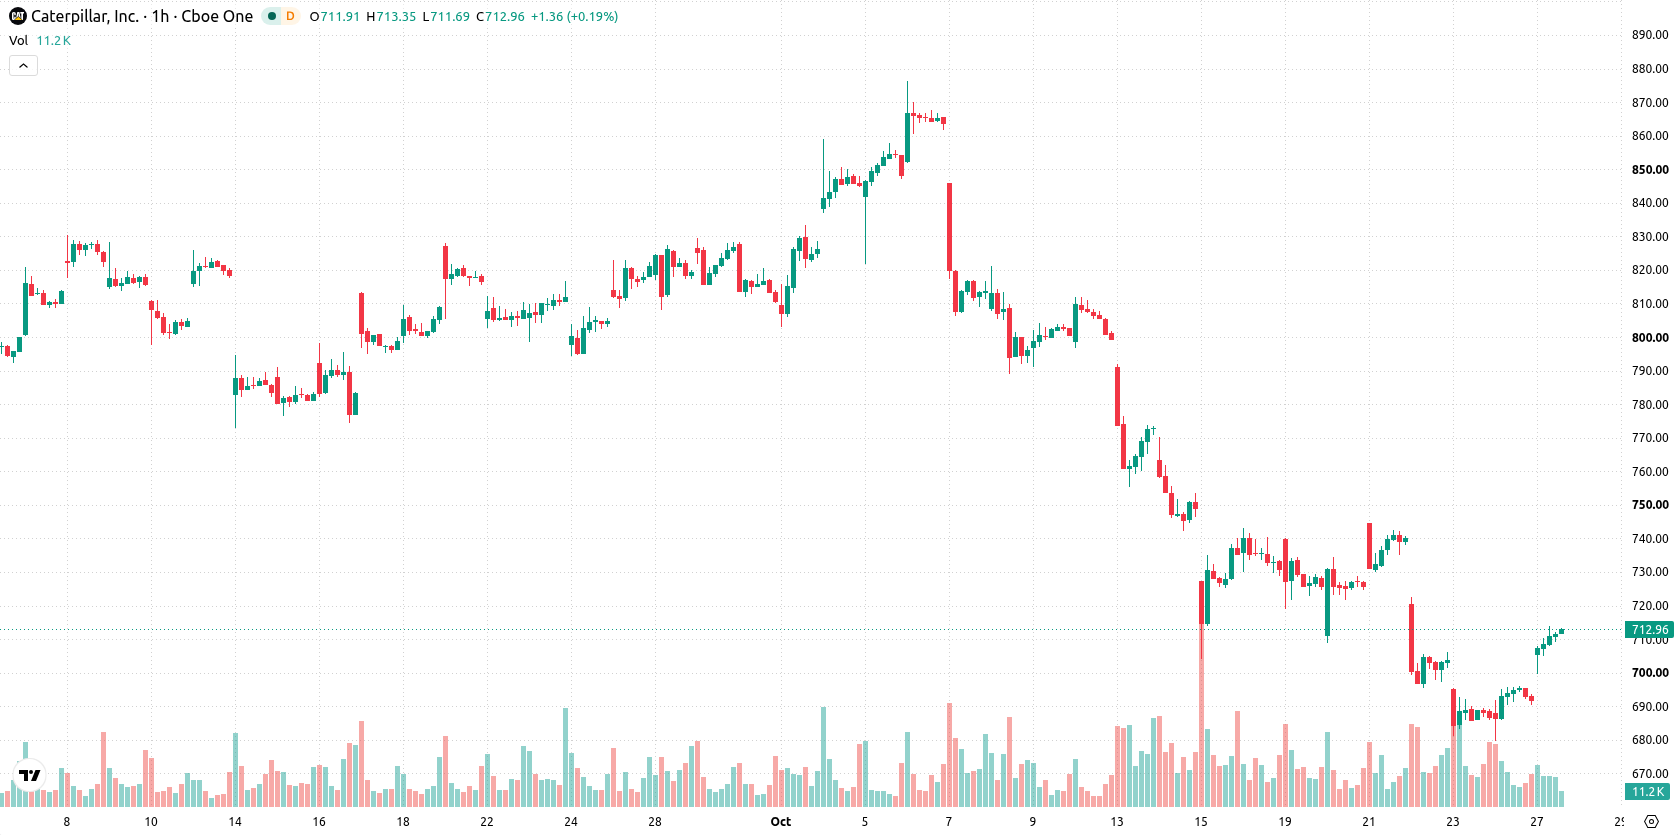
Caterpillar (CAT) stock is trading at $712.93, marking a daily gain of 3.06%. The price finished the session above its key short-term averages, supported by resilient intraday movement despite lingering below the medium- and long-term moving averages.
 590.62
613.42
Highlights
- Caterpillar confirms a $1.63 quarterly dividend for November 2026 and maintains a strong balance sheet.
- A $1 billion North Carolina investment and record $72 billion backlog support growth and resilient demand tied to AI data centers.
- CAT/USD trades above short-term averages but shows bearish momentum, with a projected range of $684.8 to $741.06 and 65% down probability.
Dividend hike, capex, and record backlog lift investor confidence
Caterpillar has confirmed a quarterly dividend of $1.63, payable on November 19, 2026, reflecting ongoing commitment to shareholder returns and a strong balance sheet, according to Yahoo Finance. The company is further strengthening its market position through a $1 billion investment in North Carolina to expand Cat Compact manufacturing, targeting growth opportunities tied to increasing demand. Additionally, robust orders for power generation equipment linked to AI data centers have pushed Caterpillar’s backlog to a record $72 billion, highlighting resilient end-market demand and providing fundamental support. In a separate development, the firm is challenging UK tariffs on Chinese diggers, as reported by Newsquawk, a move that could enhance its competitive positioning in regulated markets.
Mixed momentum persists as MA-20 support conflicts with selling pressure
On the H1 chart, CAT trades above the MA-20 but remains under both the MA-50 and MA-200. The immediate support level is set by the Ichimoku Kijun at $711.11, while technical resistance stands near the recent session high. Momentum indicators present a mixed picture: MACD signals a strong sell alongside selling pressure from ADX, while RSI continues to reflect a bearish bias. Both Stochastic RSI and CCI are neutral, suggesting neither oversold nor overbought conditions, and the Awesome Oscillator also remains neutral. Bull/Bear Power confirms sellers are dominant in intraday activity.
Bearish bias prevails as downside risk outweighs breakout odds
For the coming sessions, CAT is projected to move within a volatility band of $684.8 to $741.06. Statistically, there is a 35% probability of an upside breakout, while the chances of a downside move are higher at 65%. If the price holds its current range, a period of sideways consolidation may develop. A bullish scenario would require a clear close above resistance, whereas a bearish shift would be triggered should the price drop below immediate support.
Earlier, analysts noted that Caterpillar was facing persistent technical weakness, with downside pressure prevailing despite supportive fundamentals such as a strong order backlog. The current outlook adds a new dimension by highlighting mixed momentum signals and the potential for sideways consolidation, with immediate focus on whether CAT can maintain support at $711.11 or break out of the projected volatility band of $684.8 to $741.06.










-
 Afghanistan
-
 Albania
-
 Algeria
-
 Angola
-
 Argentina
-
 Armenia
-
 Australia
-
 Austria
-
 Azerbaijan
-
 Bahamas
-
 Bahrain
-
 Bangladesh
-
 Belarus
-
 Belgium
-
 Bolivia
-
 Botswana
-
 Brazil
-
 Brunei
-
 Bulgaria
-
 Cambodia
-
 Cameroon
-
 Canada
-
 Chile
-
 China
-
 Colombia
-
 Congo
-
 Costa Rica
-
 Cote d'Ivoire
-
 Croatia
-
 Cuba
-
 Cyprus
-
 Czechia
-
 DR Congo
-
 Denmark
-
 Dominican Republic
-
 Ecuador
-
 Egypt
-
 El Salvador
-
 Estonia
-
 Eswatini
-
 Ethiopia
-
 Finland
-
 France
-
 Georgia
-
 Germany
-
 Ghana
-
 Greece
-
 Haiti
-
 Hong Kong
-
 Hungary
-
 India
-
 Indonesia
-
 Iran, Islamic republic
-
 Iraq
-
 Ireland
-
 Israel
-
 Italy
-
 Jamaica
-
 Japan
-
 Jordan
-
 Kazakhstan
-
 Kenya
-
 Korea
-
 Kuwait
-
 Kyrgyzstan
-
 Laos
-
 Latvia
-
 Lebanon
-
 Lesotho
-
 Libya
-
 Lithuania
-
 Luxembourg
-
 Madagascar
-
 Malaysia
-
 Malta
-
 Mauritius
-
 Mexico
-
 Moldova
-
 Mongolia
-
 Montenegro
-
 Morocco
-
 Mozambique
-
 Myanmar
-
 Namibia
-
 Nepal
-
 Netherlands
-
 New Zealand
-
 Nigeria
-
 North Macedonia
-
 Norway
-
 Oman
-
 Pakistan
-
 Palestine
-
 Panama
-
 Papua New Guinea
-
 Paraguay
-
 Peru
-
 Philippines
-
 Poland
-
 Portugal
-
 Puerto Rico
-
 Qatar
-
 Reunion
-
 Romania
-
 Rwanda
-
 Saudi Arabia
-
 Serbia
-
 Singapore
-
 Slovakia
-
 Slovenia
-
 Somalia
-
 South Africa
-
 Spain
-
 Sri Lanka
-
 Sweden
-
 Switzerland
-
 Syria
-
 Taiwan
-
 Tajikistan
-
 Tanzania
-
 Thailand
-
 Trinidad and Tobago
-
 Tunisia
-
 Turkey
-
 UAE
-
 Uganda
-
 Ukraine
-
 United Kingdom
-
United States
-
 Uruguay
-
 Uzbekistan
-
 Venezuela
-
 Vietnam
-
 Yemen
-
 Zambia
-
 Zimbabwe
- Forex
- Crypto












