

GE Aerospace shares technical analysis: Upward price move confirmed by strong buyer activity

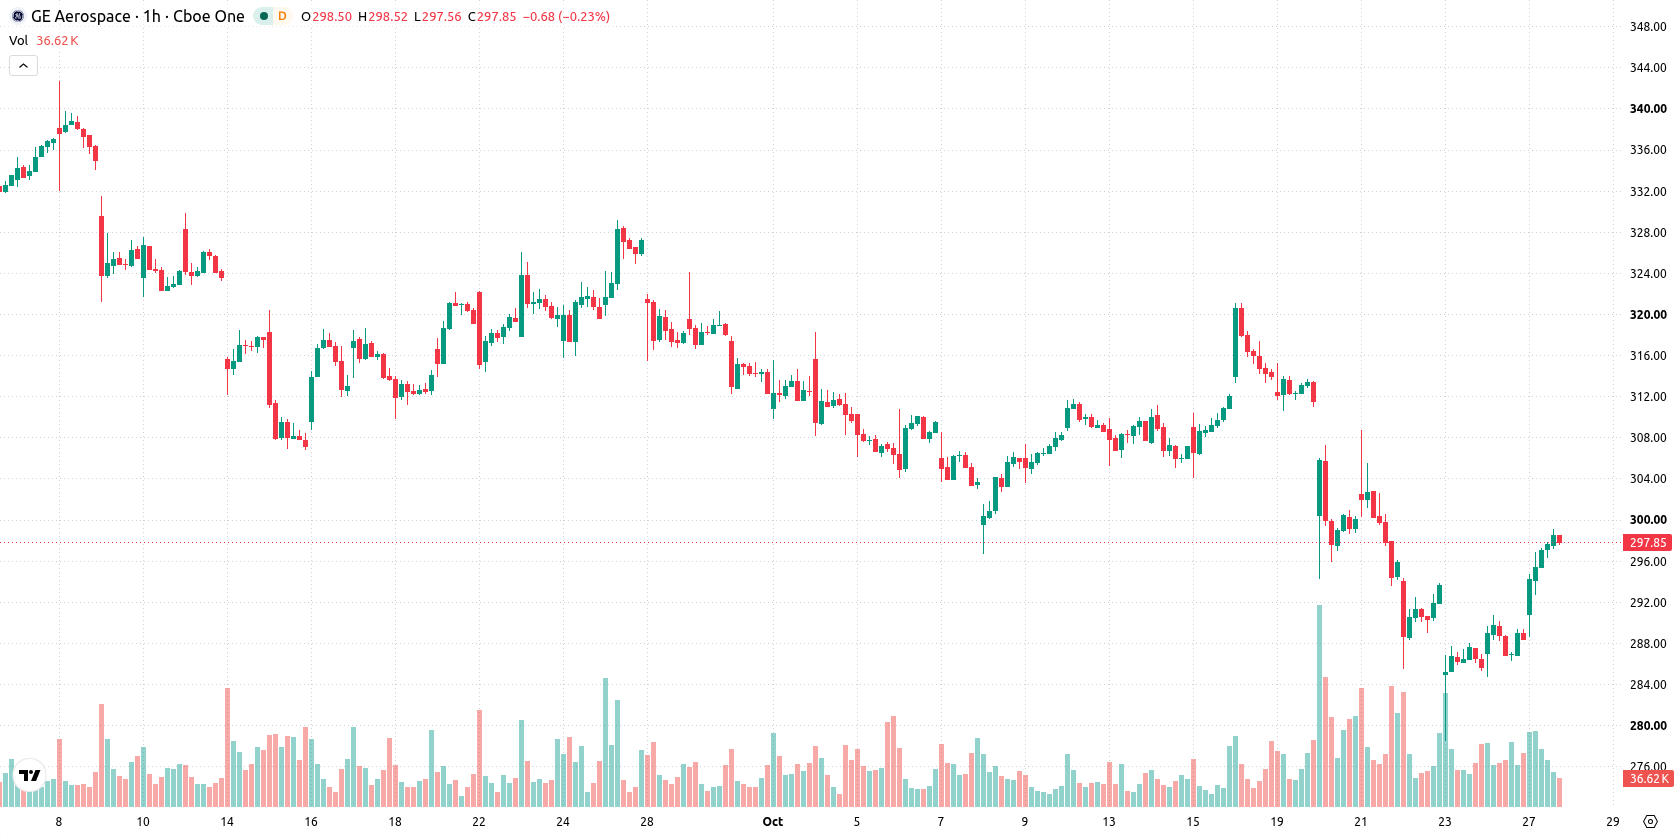
GE Aerospace (GE) stock is trading at $297.73, up 3.22% on the session and near its daily high. The price sits above its short-term averages but remains below key medium- and long-term levels.
 333.05
342.80
Highlights
- GE Aerospace stock saw improved profitability in Q3 2026, posting revenue of $14,118 million and net income of $2,288 million.
- A $4 billion share buyback retired 11.9 million shares, directly raising earnings per share, with a $212 billion order backlog supporting future stability.
- Shares trade above short-term but below medium- and long-term moving averages, with mixed momentum signals and an expected $284.62 to $310.84 range the next few days.
Earnings and buybacks drive rally despite selective institutional reduction
GE Aerospace's latest quarterly results showed Q3 2026 revenue of $14,118 million and a net income of $2,288 million, with higher earnings per share from continuing operations compared to the prior year—signaling improved profitability and driving demand for the stock. The completed $4.0 billion share buyback, which retired nearly 11.9 million shares, further tightened the float and mechanically lifted per-share metrics, directly supporting the price. GE Aerospace's record $212 billion backlog reinforces confidence in sustained order flows and earnings stability, while a 23% reduction in holdings by Verdence Capital Advisors LLC, as reported by MarketBeat, introduces a minor counterpoint from the institutional side. Collectively, these developments provide a strong operational and transactional foundation for the current upward move.
Mixed momentum as overbought signals clash with resistance
GE opened the session above the SMA-20 ($295.23), but remains capped below both the SMA-50 ($301.09) and SMA-200 ($312.78). Immediate support is defined by the Ichimoku Kijun at $290.46. The momentum picture is divergent: RSI is in buy territory while ADX shows strengthening buyer activity, yet MACD gives a strong sell signal. Stoch RSI, CCI, and Bull/Bear Power readings continue to indicate aggressively overbought conditions, bringing volatility and potential for sharp moves around these technical levels.
Directional uncertainty as volatility defines short-term trading band
Looking ahead 2–3 sessions, GE is expected to trade within a band of $284.62 to $310.84, reflecting the current volatility band relative to present levels. Modelled probability is slightly tilted toward a downside move (52% down, 48% up), but a baseline scenario calls for continued sideways action within this corridor. A bullish continuation would require a clean break above resistance, while a bearish scenario could develop if price falls through the next support.
Earlier, analysts noted that GE Aerospace’s strong financial performance and capital return measures had not yet overcome the stock’s persistent technical weakness. The current analysis adds a new dimension by highlighting conflicting momentum signals and forecasting potential for sharp volatility, with $290.46 standing out as the critical short-term level to monitor for directional confirmation.






Latest General Electric News





-
 Afghanistan
-
 Albania
-
 Algeria
-
 Angola
-
 Argentina
-
 Armenia
-
 Australia
-
 Austria
-
 Azerbaijan
-
 Bahamas
-
 Bahrain
-
 Bangladesh
-
 Belarus
-
 Belgium
-
 Bolivia
-
 Botswana
-
 Brazil
-
 Brunei
-
 Bulgaria
-
 Cambodia
-
 Cameroon
-
 Canada
-
 Chile
-
 China
-
 Colombia
-
 Congo
-
 Costa Rica
-
 Cote d'Ivoire
-
 Croatia
-
 Cuba
-
 Cyprus
-
 Czechia
-
 DR Congo
-
 Denmark
-
 Dominican Republic
-
 Ecuador
-
 Egypt
-
 El Salvador
-
 Estonia
-
 Eswatini
-
 Ethiopia
-
 Finland
-
 France
-
 Georgia
-
 Germany
-
 Ghana
-
 Greece
-
 Haiti
-
 Hong Kong
-
 Hungary
-
 India
-
 Indonesia
-
 Iran, Islamic republic
-
 Iraq
-
 Ireland
-
 Israel
-
 Italy
-
 Jamaica
-
 Japan
-
 Jordan
-
 Kazakhstan
-
 Kenya
-
 Korea
-
 Kuwait
-
 Kyrgyzstan
-
 Laos
-
 Latvia
-
 Lebanon
-
 Lesotho
-
 Libya
-
 Lithuania
-
 Luxembourg
-
 Madagascar
-
 Malaysia
-
 Malta
-
 Mauritius
-
 Mexico
-
 Moldova
-
 Mongolia
-
 Montenegro
-
 Morocco
-
 Mozambique
-
 Myanmar
-
 Namibia
-
 Nepal
-
 Netherlands
-
 New Zealand
-
 Nigeria
-
 North Macedonia
-
 Norway
-
 Oman
-
 Pakistan
-
 Palestine
-
 Panama
-
 Papua New Guinea
-
 Paraguay
-
 Peru
-
 Philippines
-
 Poland
-
 Portugal
-
 Puerto Rico
-
 Qatar
-
 Reunion
-
 Romania
-
 Rwanda
-
 Saudi Arabia
-
 Serbia
-
 Singapore
-
 Slovakia
-
 Slovenia
-
 Somalia
-
 South Africa
-
 Spain
-
 Sri Lanka
-
 Sweden
-
 Switzerland
-
 Syria
-
 Taiwan
-
 Tajikistan
-
 Tanzania
-
 Thailand
-
 Trinidad and Tobago
-
 Tunisia
-
 Turkey
-
 UAE
-
 Uganda
-
 Ukraine
-
 United Kingdom
-
United States
-
 Uruguay
-
 Uzbekistan
-
 Venezuela
-
 Vietnam
-
 Yemen
-
 Zambia
-
 Zimbabwe
- Forex
- Crypto












