


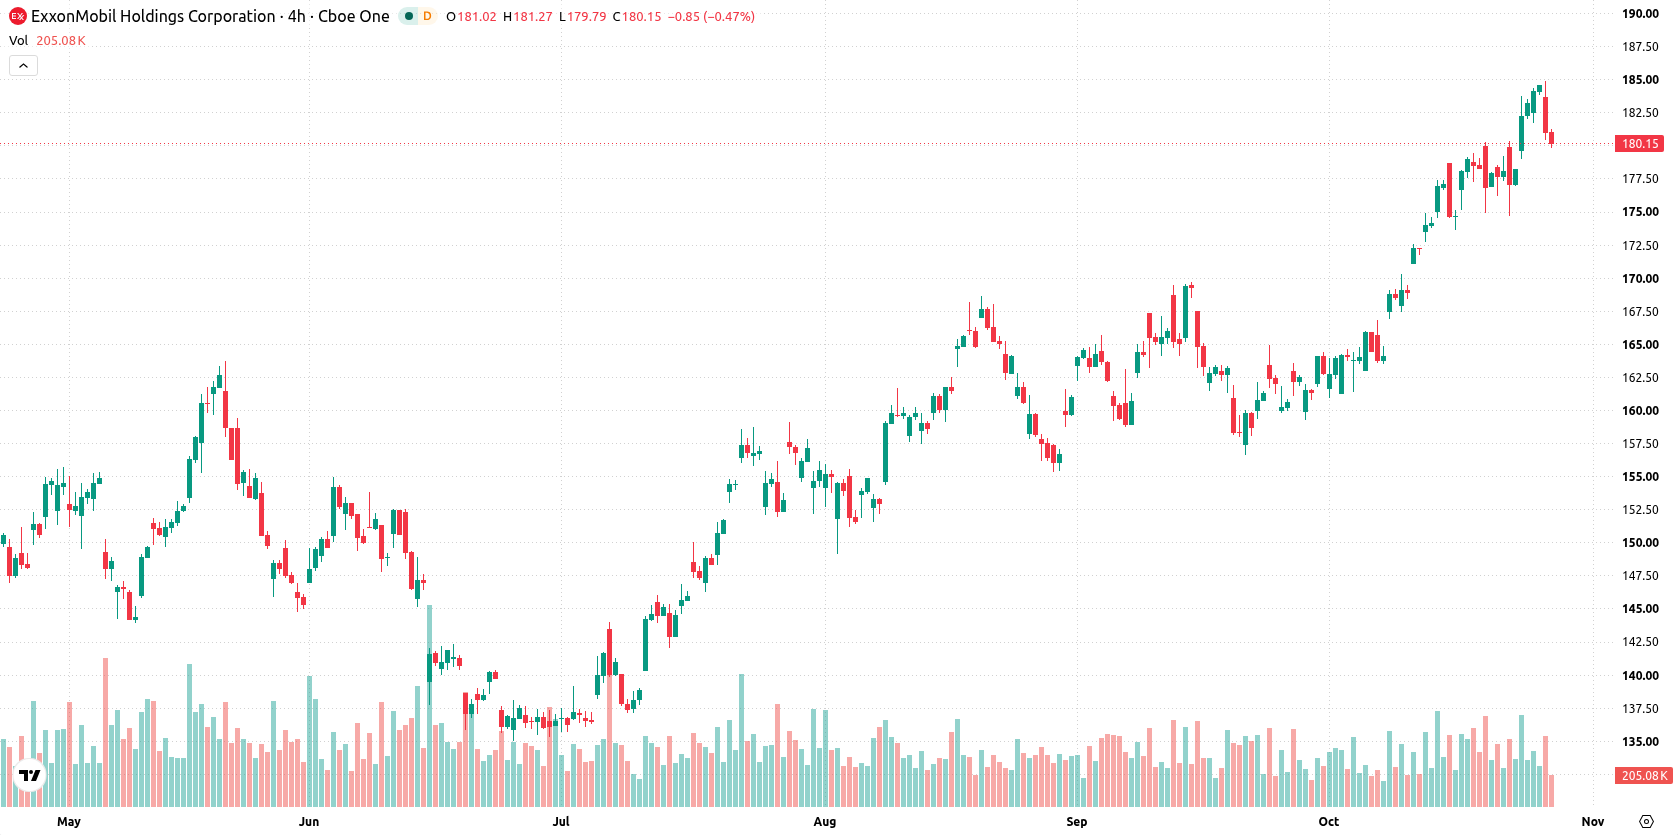
Exxon Mobil Corporation (XOM) fell 2.3% as an early downside gap and heavy intraday selling overshadowed recent signals of robust operational performance and increased institutional investments. The magnitude of today's drop contradicts the current bullish technical structure, as the price remains above key moving averages and recent momentum indicators favor buyers.
 183.64
184.88
Highlights
- Exxon Mobil reported a $4.5 billion jump in refining earnings for the third quarter, citing higher margins and strong operations.
- Institutional investors increased positions in XOM and ETFs saw net inflows in late October, with the company maintaining dividend and buyback activity.
- Exxon Mobil stock trades in a bullish long-term trend with buyers dominant, but overbought technicals and current price action near support levels suggest consolidation between $175.32 and $185.28 in the coming days.
Net inflows and capital returns persist amid persistent selling pressure
Exxon Mobil is scheduled to report its third-quarter earnings on October 30. The company reported a $4.5 billion increase in refining earnings for the quarter, attributed to higher margins from global events and strong operational results. Multiple large institutional investors added or increased positions in XOM in the most recent quarter, and ETF flows showed considerable net inflows in late October. The company maintained its record of dividend payments and share buybacks, focusing on operational efficiency and capital returns, though price action has remained under broader selling pressure.
Overbought conditions challenge buyers as technical structure stays bullish
Exxon Mobil is trading above its 20-day, 50-day, and 200-day moving averages ($171.99, $166.27, and $153.46 respectively), confirming a bullish structure across short-, medium-, and long-term trends. The nearest resistance is the near-term ceiling at $181.52, with support at $175.32, and the MA-50 vs MA-200 alignment also signals a positive long-term backdrop. Short-term momentum remains strong, reflected in bullish forecasts from the Moving Average Convergence Divergence (MACD) and Average Directional Index (ADX). However, the Relative Strength Index (RSI) at 76.98, Commodity Channel Index (CCI) at 126.93, and Stochastic RSI at 100 highlight pronounced overbought conditions. Bull/Bear Power (BBP) at 7.87 confirms buyers dominate intraday momentum, but is flagged as overbought. The Awesome Oscillator (AO) is supportive of the current trend. The stock is currently at $180.3, down $4.24 or 2.3% after opening with a downside gap of about $2.68 (1.45%). The price sits near the daily low and intraday volatility stands at 1.69%. An early gap lower with heavy downside keeps the intraday tone under pressure despite recent momentum signals favoring buyers.
Earlier, analysts noted that Exxon Mobil's uptrend was bolstered by strong technical momentum and renewed institutional interest. The latest price action, marked by a sharp intraday decline despite bullish indicators, adds a note of caution ahead of earnings, making support at $175.32 the key level for traders to monitor in the coming sessions.











-
 Afghanistan
-
 Albania
-
 Algeria
-
 Angola
-
 Argentina
-
 Armenia
-
 Australia
-
 Austria
-
 Azerbaijan
-
 Bahamas
-
 Bahrain
-
 Bangladesh
-
 Belarus
-
 Belgium
-
 Bolivia
-
 Botswana
-
 Brazil
-
 Brunei
-
 Bulgaria
-
 Cambodia
-
 Cameroon
-
 Canada
-
 Chile
-
 China
-
 Colombia
-
 Congo
-
 Costa Rica
-
 Cote d'Ivoire
-
 Croatia
-
 Cuba
-
 Cyprus
-
 Czechia
-
 DR Congo
-
 Denmark
-
 Dominican Republic
-
 Ecuador
-
 Egypt
-
 El Salvador
-
 Estonia
-
 Eswatini
-
 Ethiopia
-
 Finland
-
 France
-
 Georgia
-
 Germany
-
 Ghana
-
 Greece
-
 Haiti
-
 Hong Kong
-
 Hungary
-
 India
-
 Indonesia
-
 Iran, Islamic republic
-
 Iraq
-
 Ireland
-
 Israel
-
 Italy
-
 Jamaica
-
 Japan
-
 Jordan
-
 Kazakhstan
-
 Kenya
-
 Korea
-
 Kuwait
-
 Kyrgyzstan
-
 Laos
-
 Latvia
-
 Lebanon
-
 Lesotho
-
 Libya
-
 Lithuania
-
 Luxembourg
-
 Madagascar
-
 Malaysia
-
 Malta
-
 Mauritius
-
 Mexico
-
 Moldova
-
 Mongolia
-
 Montenegro
-
 Morocco
-
 Mozambique
-
 Myanmar
-
 Namibia
-
 Nepal
-
 Netherlands
-
 New Zealand
-
 Nigeria
-
 North Macedonia
-
 Norway
-
 Oman
-
 Pakistan
-
 Palestine
-
 Panama
-
 Papua New Guinea
-
 Paraguay
-
 Peru
-
 Philippines
-
 Poland
-
 Portugal
-
 Puerto Rico
-
 Qatar
-
 Reunion
-
 Romania
-
 Rwanda
-
 Saudi Arabia
-
 Serbia
-
 Singapore
-
 Slovakia
-
 Slovenia
-
 Somalia
-
 South Africa
-
 Spain
-
 Sri Lanka
-
 Sweden
-
 Switzerland
-
 Syria
-
 Taiwan
-
 Tajikistan
-
 Tanzania
-
 Thailand
-
 Trinidad and Tobago
-
 Tunisia
-
 Turkey
-
 UAE
-
 Uganda
-
 Ukraine
-
 United Kingdom
-
United States
-
 Uruguay
-
 Uzbekistan
-
 Venezuela
-
 Vietnam
-
 Yemen
-
 Zambia
-
 Zimbabwe
- Forex
- Crypto












