

Exxon Mobil shares retreat further as MACD and ADX maintain sell signals: weekly analysis

Shares of Exxon Mobil Corporation (XOM) are trading near $167, having slipped more than 2% over the past week as technical indicators point to continued downside but with possible rebound risk. The decline has pushed XOM into technically oversold territory, reflecting an environment where selling pressure is prominent but a short-term reversal cannot be ruled out. Traders will closely watch for a shift in momentum amid these conflicting signals.
 164.76
170.91
Highlights
- Shares of Exxon Mobil fell 2.16% over the past 7 days to $166.87 and currently trade below the 20-day and 50-day moving averages.
- Technical indicators MACD and ADX show a persistent downward trend, with Stochastic RSI oversold, indicating possible short-term selling exhaustion.
- Key support is at $160.31 and resistance at $169.54, with next week’s expected stock range between $162.12 and $171.61.
Debt buyback and dividend hike anchor sentiment amid new project spend
ExxonMobil announced a $3 billion debt repurchase through its subsidiaries on November 16, 2026, supporting its focus on balance sheet strength according to GuruFocus. The energy giant also raised its quarterly dividend by 3.9% to $1.07 per share, marking its 44th consecutive annual increase as reported by The Motley Fool. Additionally, the company disclosed a $12.5 billion investment in a new offshore Guyana development, according to Benzinga.
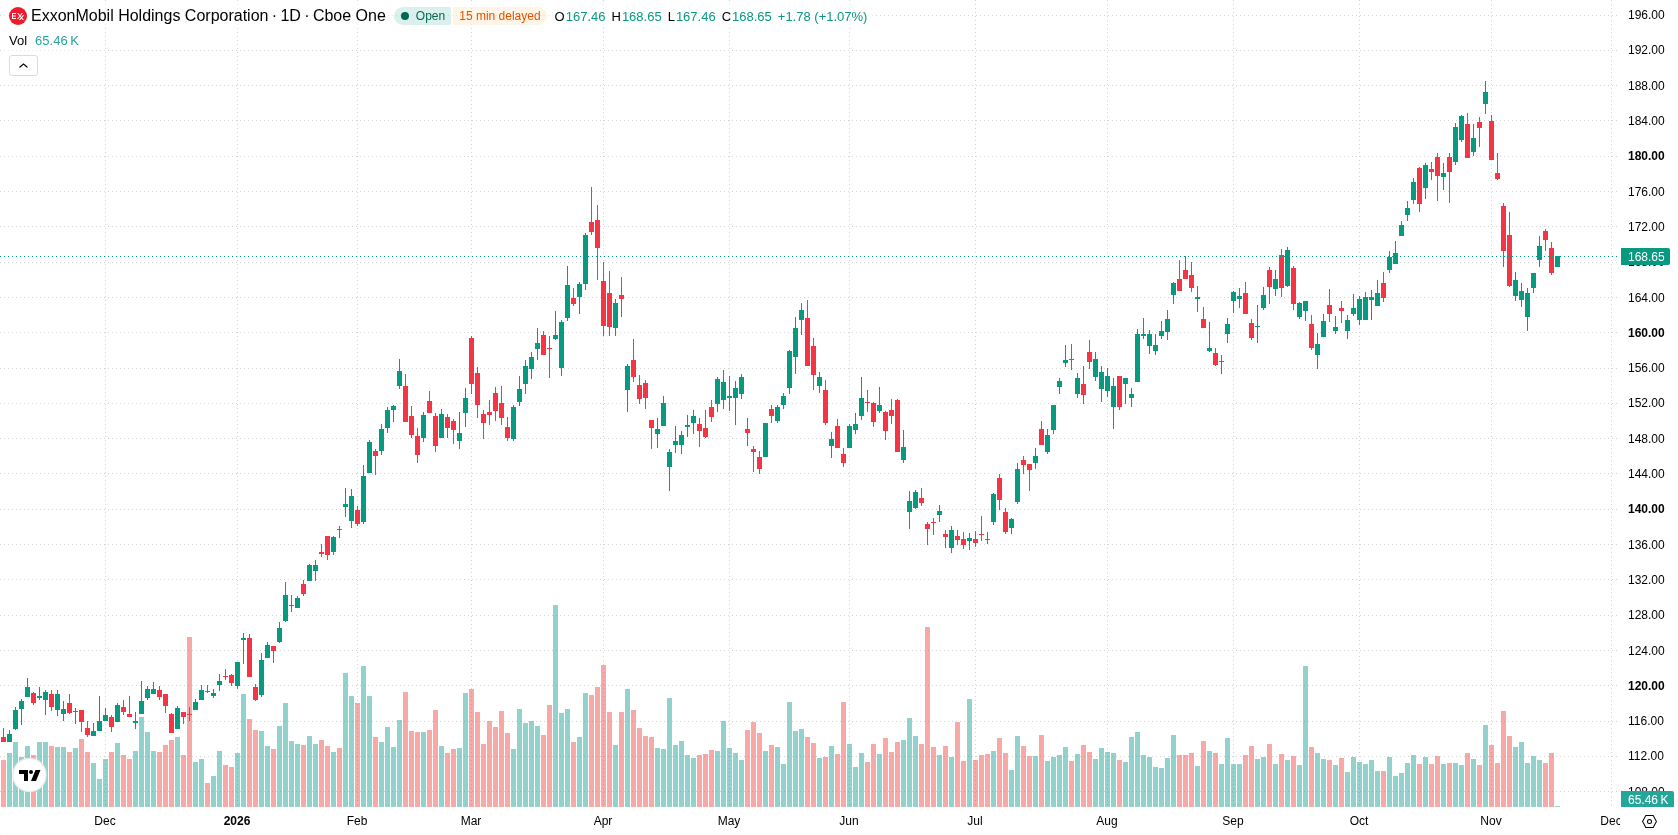
Bearish momentum holds this week as MACD and ADX reinforce oversold setup
On the daily chart, the technical picture shows a sustained move lower with a firm trend, as highlighted by the MACD and ADX both signaling sell, while Stochastic RSI has entered oversold territory (15.35), suggesting possible selling exhaustion. Oscillator readings overall are neutral except for the Stoch RSI, which points to a risk of an upcoming rebound. Nearest support is seen at $160.31, and resistance aligns with the 50-day moving average at $169.54, backed by moderate volatility at 6.61%. The Ichimoku Kijun at $174.11 adds another layer of resistance above.
Bias points lower next week unless support triggers rebound within range
Next week, the expected range for Exxon Mobil stock is $162.12 to $171.61. The probabilities stand at 33% for an increase and 67% for a decrease. The base case sees price holding between the $160.31 support and $169.54 resistance. A bullish break above $169.54 would open room toward the top of the range, while a confirmed drop below $160.31 would signal resumed downside within the forecast window.
Previously it was reported that ExxonMobil's rapid production growth in Guyana was heightening both investment prospects and oversight challenges for the company. The current technical setup now adds a layer of short-term uncertainty, making $160.31 a crucial support level for traders monitoring potential downside risk.






Latest Exxon News





-
 Afghanistan
-
 Albania
-
 Algeria
-
 Angola
-
 Argentina
-
 Armenia
-
 Australia
-
 Austria
-
 Azerbaijan
-
 Bahamas
-
 Bahrain
-
 Bangladesh
-
 Belarus
-
 Belgium
-
 Bolivia
-
 Botswana
-
 Brazil
-
 Brunei
-
 Bulgaria
-
 Cambodia
-
 Cameroon
-
 Canada
-
 Chile
-
 China
-
 Colombia
-
 Congo
-
 Costa Rica
-
 Cote d'Ivoire
-
 Croatia
-
 Cuba
-
 Cyprus
-
 Czechia
-
 DR Congo
-
 Denmark
-
 Dominican Republic
-
 Ecuador
-
 Egypt
-
 El Salvador
-
 Estonia
-
 Eswatini
-
 Ethiopia
-
 Finland
-
 France
-
 Georgia
-
 Germany
-
 Ghana
-
 Greece
-
 Haiti
-
 Hong Kong
-
 Hungary
-
 India
-
 Indonesia
-
 Iran, Islamic republic
-
 Iraq
-
 Ireland
-
 Israel
-
 Italy
-
 Jamaica
-
 Japan
-
 Jordan
-
 Kazakhstan
-
 Kenya
-
 Korea
-
 Kuwait
-
 Kyrgyzstan
-
 Laos
-
 Latvia
-
 Lebanon
-
 Lesotho
-
 Libya
-
 Lithuania
-
 Luxembourg
-
 Madagascar
-
 Malaysia
-
 Malta
-
 Mauritius
-
 Mexico
-
 Moldova
-
 Mongolia
-
 Montenegro
-
 Morocco
-
 Mozambique
-
 Myanmar
-
 Namibia
-
 Nepal
-
 Netherlands
-
 New Zealand
-
 Nigeria
-
 North Macedonia
-
 Norway
-
 Oman
-
 Pakistan
-
 Palestine
-
 Panama
-
 Papua New Guinea
-
 Paraguay
-
 Peru
-
 Philippines
-
 Poland
-
 Portugal
-
 Puerto Rico
-
 Qatar
-
 Reunion
-
 Romania
-
 Rwanda
-
 Saudi Arabia
-
 Serbia
-
 Singapore
-
 Slovakia
-
 Slovenia
-
 Somalia
-
 South Africa
-
 Spain
-
 Sri Lanka
-
 Sweden
-
 Switzerland
-
 Syria
-
 Taiwan
-
 Tajikistan
-
 Tanzania
-
 Thailand
-
 Trinidad and Tobago
-
 Tunisia
-
 Turkey
-
 UAE
-
 Uganda
-
 Ukraine
-
 United Kingdom
-
United States
-
 Uruguay
-
 Uzbekistan
-
 Venezuela
-
 Vietnam
-
 Yemen
-
 Zambia
-
 Zimbabwe
- Forex
- Crypto












