

SNDL shares technical analysis: Buyer support underpins strength toward $1.34 resistance

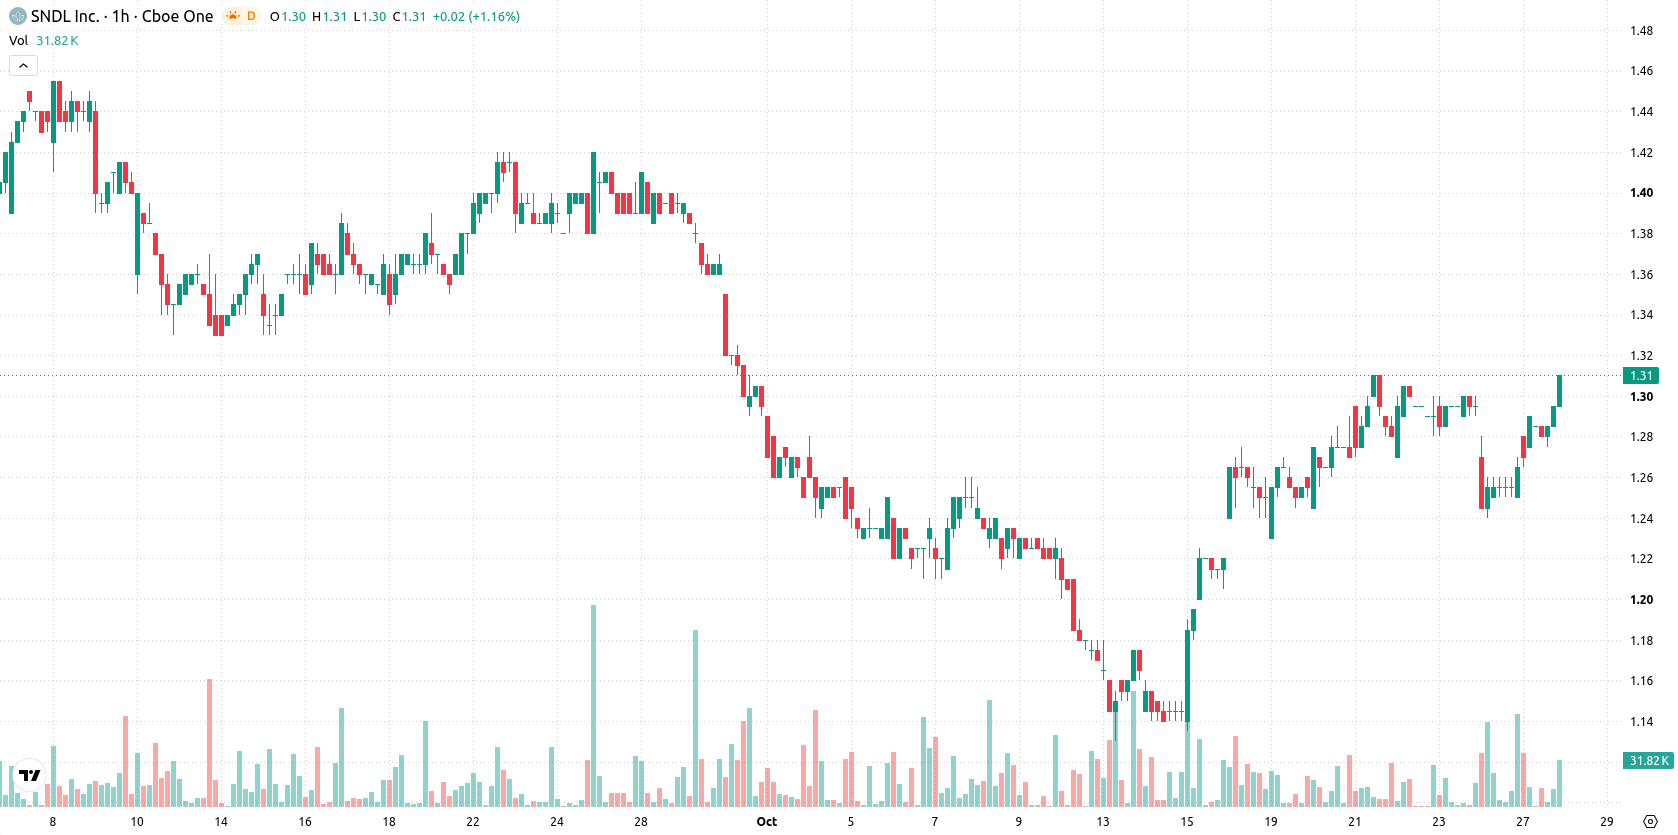
SNDL Inc. (SNDL) stock is trading at $1.3 after rising 2.36% intraday. The price has advanced above its key short- and medium-term moving averages, but remains below its 200-day level.
 1.30
1.34
Highlights
- SNDL Inc. generated record third-quarter 2026 free cash flow of CAD 20 million and reported positive adjusted operating income of CAD 5.2 million.
- The company remains debt-free with CAD 132 million in unrestricted cash, completed U.S. investments, executed share repurchases, and will reduce its manufacturing workforce to trim future costs.
- SNDL stock trades with short- and medium-term bullish momentum and is expected to hold within a $1.26 to $1.34 range, with very high probability of further upside but multiple overbought indicator signals.
Enhanced liquidity and profitability as cash flow and cost cuts drive confidence
SNDL Inc. has posted record third-quarter 2026 free cash flow of CAD 20.0 million, enhancing its internal liquidity and reinforcing the company's capacity for reinvestment and shareholder returns. The firm also reported positive adjusted operating income of CAD 5.2 million, demonstrating core profitability despite ongoing weakness in its Cannabis Operations segment, which saw a CAD 1.6 million gross loss. SNDL executed significant share repurchases, maintained a debt-free balance sheet with CAD 132 million in unrestricted cash, and completed strategic investments in the U.S., all of which support market confidence and provide a stable platform for future initiatives. The announcement of a substantial workforce reduction at its manufacturing facility aims to trim costs for upcoming quarters and complements an improving operational outlook.
Mixed momentum and overbought signals as key levels tested
On the technical front, SNDL is trading above its MA-20 and MA-50 at $1.27, while remaining below the MA-200 at $1.4 on the daily chart. The Ichimoku Kijun sits at $1.27, providing immediate support. Momentum measures present a mixed picture: RSI stands at 62.72 (Buy), MACD is Neutral, and ADX gives a Buy signal. Both Stochastic RSI and CCI are in overbought territory, pointing to stretched short-term conditions. Bull/Bear Power signals intraday buyer dominance, while the Awesome Oscillator remains neutral and does not currently confirm the trend.
Range-bound outlook as upside outweighs downside risk
In the near term, SNDL is expected to trade within a $1.26 to $1.34 range, reflecting typical volatility around current levels. The most likely scenario sees the price holding within this corridor, with a high probability of further upside and limited downside risk. A decisive breakout above resistance could fuel an extended rally, while a drop below support at $1.27 would open the door to a bearish reversal.
Earlier, analysts noted that SNDL was consolidating within a narrow price range against a backdrop of mixed technical signals and muted directional conviction. The current analysis strengthens this view, as improved liquidity and profitability have emerged alongside continued resistance below the long-term average, making a breakout above the 200-day moving average the key level to watch for any further upside.









-
 Afghanistan
-
 Albania
-
 Algeria
-
 Angola
-
 Argentina
-
 Armenia
-
 Australia
-
 Austria
-
 Azerbaijan
-
 Bahamas
-
 Bahrain
-
 Bangladesh
-
 Belarus
-
 Belgium
-
 Bolivia
-
 Botswana
-
 Brazil
-
 Brunei
-
 Bulgaria
-
 Cambodia
-
 Cameroon
-
 Canada
-
 Chile
-
 China
-
 Colombia
-
 Congo
-
 Costa Rica
-
 Cote d'Ivoire
-
 Croatia
-
 Cuba
-
 Cyprus
-
 Czechia
-
 DR Congo
-
 Denmark
-
 Dominican Republic
-
 Ecuador
-
 Egypt
-
 El Salvador
-
 Estonia
-
 Eswatini
-
 Ethiopia
-
 Finland
-
 France
-
 Georgia
-
 Germany
-
 Ghana
-
 Greece
-
 Haiti
-
 Hong Kong
-
 Hungary
-
 India
-
 Indonesia
-
 Iran, Islamic republic
-
 Iraq
-
 Ireland
-
 Israel
-
 Italy
-
 Jamaica
-
 Japan
-
 Jordan
-
 Kazakhstan
-
 Kenya
-
 Korea
-
 Kuwait
-
 Kyrgyzstan
-
 Laos
-
 Latvia
-
 Lebanon
-
 Lesotho
-
 Libya
-
 Lithuania
-
 Luxembourg
-
 Madagascar
-
 Malaysia
-
 Malta
-
 Mauritius
-
 Mexico
-
 Moldova
-
 Mongolia
-
 Montenegro
-
 Morocco
-
 Mozambique
-
 Myanmar
-
 Namibia
-
 Nepal
-
 Netherlands
-
 New Zealand
-
 Nigeria
-
 North Macedonia
-
 Norway
-
 Oman
-
 Pakistan
-
 Palestine
-
 Panama
-
 Papua New Guinea
-
 Paraguay
-
 Peru
-
 Philippines
-
 Poland
-
 Portugal
-
 Puerto Rico
-
 Qatar
-
 Reunion
-
 Romania
-
 Rwanda
-
 Saudi Arabia
-
 Serbia
-
 Singapore
-
 Slovakia
-
 Slovenia
-
 Somalia
-
 South Africa
-
 Spain
-
 Sri Lanka
-
 Sweden
-
 Switzerland
-
 Syria
-
 Taiwan
-
 Tajikistan
-
 Tanzania
-
 Thailand
-
 Trinidad and Tobago
-
 Tunisia
-
 Turkey
-
 UAE
-
 Uganda
-
 Ukraine
-
 United Kingdom
-
United States
-
 Uruguay
-
 Uzbekistan
-
 Venezuela
-
 Vietnam
-
 Yemen
-
 Zambia
-
 Zimbabwe
- Forex
- Crypto












