

Costco stock weekly forecast: Mixed momentum as Stochastic RSI enters oversold territory

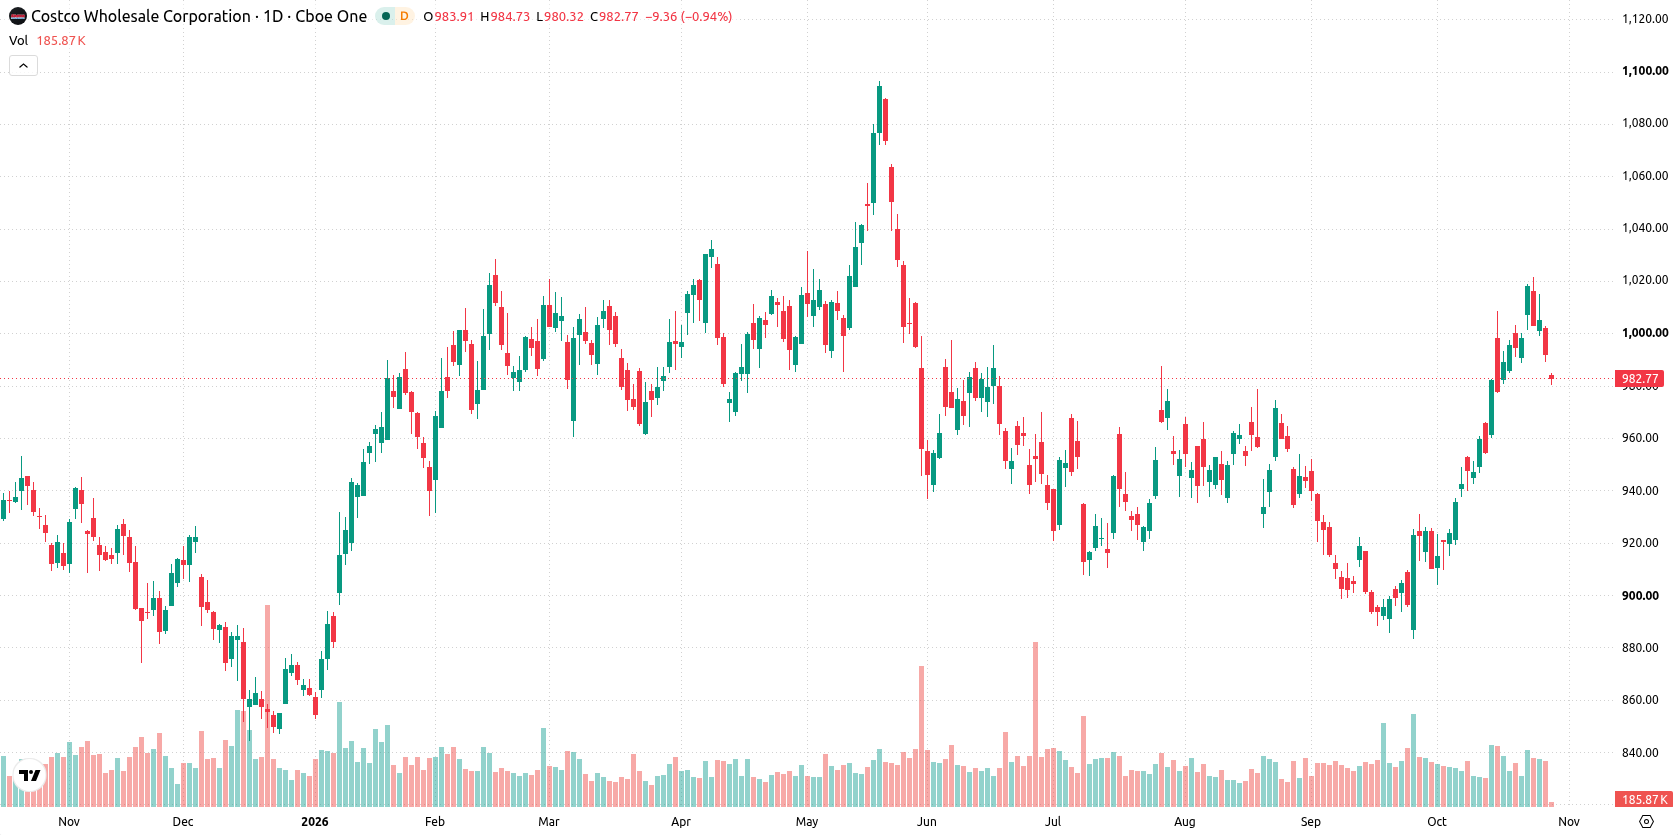
Shares of Costco Wholesale Corporation (COST) are trading near $982 after sliding a little more than 2% over the past week, as buyers managed to keep the stock in an elevated range. The recent pullback puts added focus on how demand holds up, with investors weighing recent corporate actions and steady sales momentum heading into next week.
 996.21
1020.47
Highlights
- Shares of Costco declined 2.11% over the past week to $981.78, closing at the bottom of the recent weekly range.
- The stock maintains a moderately positive long-term trend, trading above its 200-day moving average despite recent downward pressure.
- Technical signals are mixed with trend strength confirmed, oversold momentum indicators, and a base case trading range of $970.1 to $989.24, with a 73% probability of an increase next week.
Dividend declaration and strong earnings sustain sentiment despite insider moves
Costco declared a quarterly cash dividend of $1.47 per share, set for payment on November 13, 2026, to shareholders of record as of October 30, 2026, according to Simply Wall St. The company also reported September net sales of $30.02 billion. Recent disclosures showed insider share awards tied to fiscal 2026 performance conditions and tax withholding, while analysts continue to highlight robust earnings results and Costco's premium valuation.
Mixed momentum signals emerge as trend firms and volatility stays moderate
On the daily chart, Costco displays a trending setup with a sustained move lower and a firm trend, within a 3.16% volatility environment. Momentum indicators present a mixed picture, as MACD shows a buy signal at 27.07 while Stochastic RSI is in oversold territory, suggesting possible near-term rebound potential. ADX at 38.73 confirms trend strength, but oscillator readings are otherwise neutral. Immediate support sits at $970.1, with resistance at $989.24 and the Ichimoku Kijun acting as additional backing at $957.08.
Upside favored next week as support and resistance levels define outlook
Over the coming trading week, the expected range is $967.81 to $995.74, with a 73% probability of an increase and a 27% probability of a decrease. The base case favors trading between the nearest support at $970.1 and resistance at $989.24. A move above $989.24 opens room toward the upper end of the forecasted range, while a drop below $970.1 would signal risk of deeper losses.
Earlier, analysts noted that Costco maintained a strong technical profile supported by intermediate-term momentum and seasonal tailwinds. The current technical landscape introduces a more cautious tone, with volatility elevated and key support at $970.1 now serving as a crucial level to monitor for a potential shift in trading dynamics over the coming sessions.











-
 Afghanistan
-
 Albania
-
 Algeria
-
 Angola
-
 Argentina
-
 Armenia
-
 Australia
-
 Austria
-
 Azerbaijan
-
 Bahamas
-
 Bahrain
-
 Bangladesh
-
 Belarus
-
 Belgium
-
 Bolivia
-
 Botswana
-
 Brazil
-
 Brunei
-
 Bulgaria
-
 Cambodia
-
 Cameroon
-
 Canada
-
 Chile
-
 China
-
 Colombia
-
 Congo
-
 Costa Rica
-
 Cote d'Ivoire
-
 Croatia
-
 Cuba
-
 Cyprus
-
 Czechia
-
 DR Congo
-
 Denmark
-
 Dominican Republic
-
 Ecuador
-
 Egypt
-
 El Salvador
-
 Estonia
-
 Eswatini
-
 Ethiopia
-
 Finland
-
 France
-
 Georgia
-
 Germany
-
 Ghana
-
 Greece
-
 Haiti
-
 Hong Kong
-
 Hungary
-
 India
-
 Indonesia
-
 Iran, Islamic republic
-
 Iraq
-
 Ireland
-
 Israel
-
 Italy
-
 Jamaica
-
 Japan
-
 Jordan
-
 Kazakhstan
-
 Kenya
-
 Korea
-
 Kuwait
-
 Kyrgyzstan
-
 Laos
-
 Latvia
-
 Lebanon
-
 Lesotho
-
 Libya
-
 Lithuania
-
 Luxembourg
-
 Madagascar
-
 Malaysia
-
 Malta
-
 Mauritius
-
 Mexico
-
 Moldova
-
 Mongolia
-
 Montenegro
-
 Morocco
-
 Mozambique
-
 Myanmar
-
 Namibia
-
 Nepal
-
 Netherlands
-
 New Zealand
-
 Nigeria
-
 North Macedonia
-
 Norway
-
 Oman
-
 Pakistan
-
 Palestine
-
 Panama
-
 Papua New Guinea
-
 Paraguay
-
 Peru
-
 Philippines
-
 Poland
-
 Portugal
-
 Puerto Rico
-
 Qatar
-
 Reunion
-
 Romania
-
 Rwanda
-
 Saudi Arabia
-
 Serbia
-
 Singapore
-
 Slovakia
-
 Slovenia
-
 Somalia
-
 South Africa
-
 Spain
-
 Sri Lanka
-
 Sweden
-
 Switzerland
-
 Syria
-
 Taiwan
-
 Tajikistan
-
 Tanzania
-
 Thailand
-
 Trinidad and Tobago
-
 Tunisia
-
 Turkey
-
 UAE
-
 Uganda
-
 Ukraine
-
 United Kingdom
-
United States
-
 Uruguay
-
 Uzbekistan
-
 Venezuela
-
 Vietnam
-
 Yemen
-
 Zambia
-
 Zimbabwe
- Forex
- Crypto












