

Robinhood shares drop more than 3% after reporting record Q3 revenue but sharp crypto slump

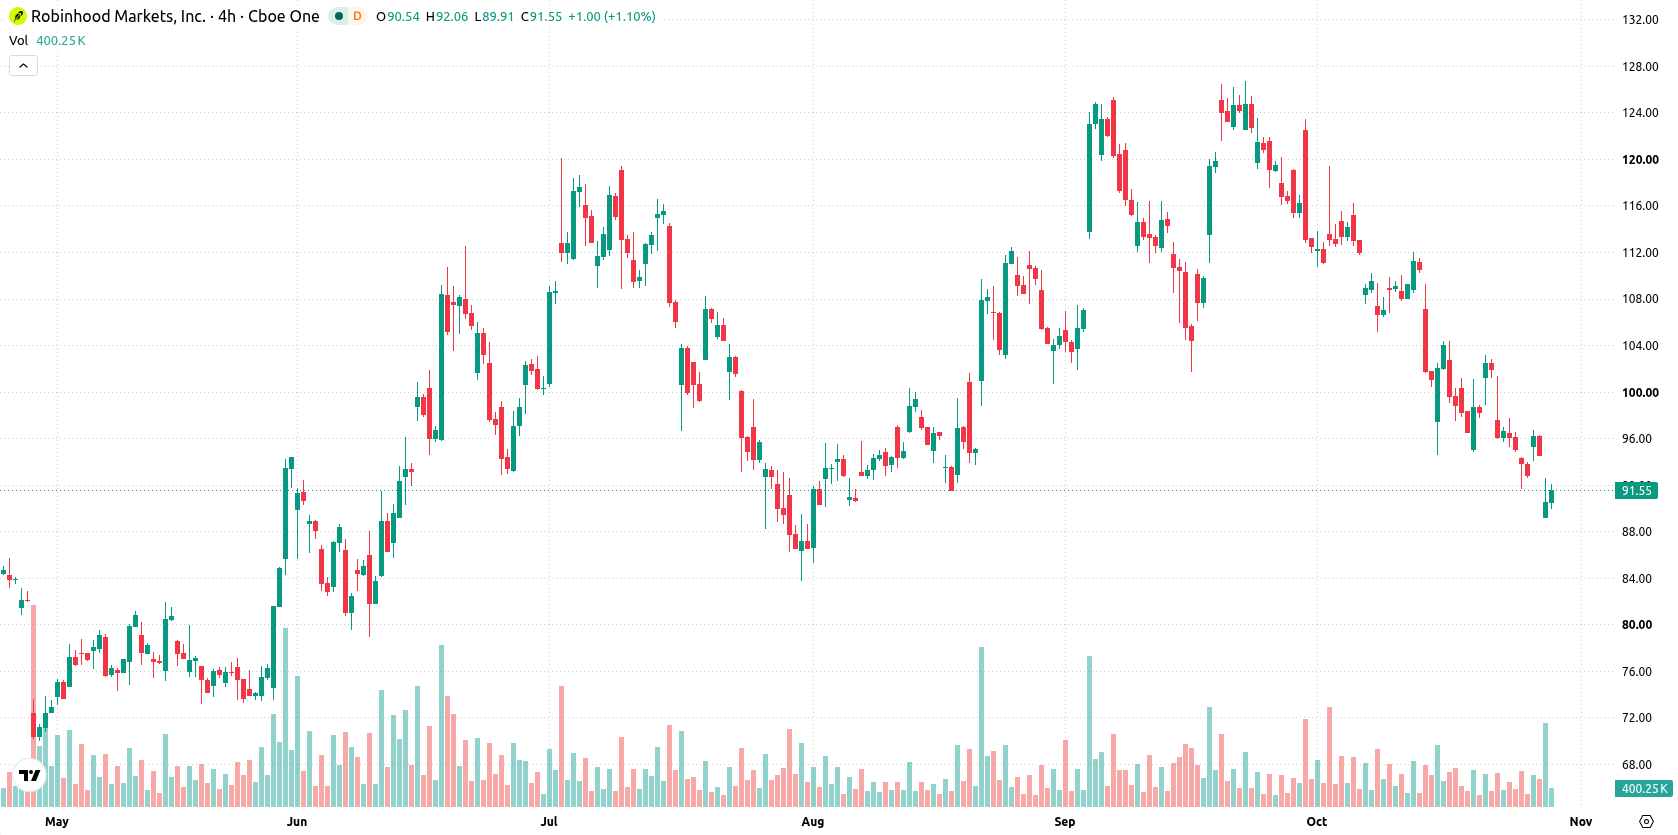
Robinhood Markets Inc (HOOD) slid 3.31% after reporting record third-quarter revenue growth and new product launches, as the market responded to a sharp drop in crypto transaction revenue and persistent selling pressure. The move is supported by the stock's continued position below all major moving averages, with immediate resistance and weak technical momentum maintaining a bearish tone.
 69.95
84.60
Highlights
- Robinhood stock posted record third-quarter 2026 revenue of $1.4 to $1.42 billion, up 12% year-over-year, but net profit and EPS declined on sharply lower crypto trading revenue.
- The company expanded its product suite with 17 new offerings across event contracts, agentic trading, perpetual futures, and around-the-clock trading for select equities, with increased activity in decentralized exchange operations.
- Robinhood stock closed at $91.54, trading below key moving averages, with mostly negative technical signals and a projected five-day range of $86.84 to $96.25.
Record core revenues offset by steep crypto decline and ongoing outflows
Robinhood reported record third-quarter 2026 revenue of $1.4–$1.42 billion, up 12% year-over-year, with all-time highs in equities, options, and margin trading transaction revenues. Net profit and EPS declined as crypto transaction revenue dropped 55% year-over-year on lower trading volumes. The company also launched 17 new products at its HOOD Summit, including event contracts, agentic trading, perpetual futures, and 24/7 trading for select equities, and highlighted ongoing partnerships and growth in its decentralized exchange operations, though price action has remained under broader selling pressure.
Bearish momentum persists amid multi-timeframe resistance and oversold signals
Robinhood is trading below its 20-day ($104.39), 50-day ($108.77), and 200-day ($93.04) moving averages, reflecting selling activity across short-, medium-, and long-term timeframes. While the MA-50 vs MA-200 trend remains bullish, the stock is currently constrained by a ceiling at $91.83 (recent week low) and a floor at $89.95 (today’s low), highlighting a narrow trading range and nearby resistance. Momentum signals are largely negative: MACD and ADX reflect ongoing selling, while RSI at 37.41 and CCI at -100.25 signal oversold conditions. Bull/Bear Power at -3.3 confirms intraday downside dominance. However, a Stochastic RSI of 20.03 points to the potential for a strong buy signal, hinting at possible short-term relief.
Previously it was reported that Robinhood faced sustained technical weakness and downside pressure, mainly driven by a significant decline in crypto transaction revenue that overshadowed positive business developments. The latest data reinforces this bearish outlook, with the current trading environment defined by a constrained range and increased risk of further downside if the recent support level fails to hold.






Latest Robinhood News





-
 Afghanistan
-
 Albania
-
 Algeria
-
 Angola
-
 Argentina
-
 Armenia
-
 Australia
-
 Austria
-
 Azerbaijan
-
 Bahamas
-
 Bahrain
-
 Bangladesh
-
 Belarus
-
 Belgium
-
 Bolivia
-
 Botswana
-
 Brazil
-
 Brunei
-
 Bulgaria
-
 Cambodia
-
 Cameroon
-
 Canada
-
 Chile
-
 China
-
 Colombia
-
 Congo
-
 Costa Rica
-
 Cote d'Ivoire
-
 Croatia
-
 Cuba
-
 Cyprus
-
 Czechia
-
 DR Congo
-
 Denmark
-
 Dominican Republic
-
 Ecuador
-
 Egypt
-
 El Salvador
-
 Estonia
-
 Eswatini
-
 Ethiopia
-
 Finland
-
 France
-
 Georgia
-
 Germany
-
 Ghana
-
 Greece
-
 Haiti
-
 Hong Kong
-
 Hungary
-
 India
-
 Indonesia
-
 Iran, Islamic republic
-
 Iraq
-
 Ireland
-
 Israel
-
 Italy
-
 Jamaica
-
 Japan
-
 Jordan
-
 Kazakhstan
-
 Kenya
-
 Korea
-
 Kuwait
-
 Kyrgyzstan
-
 Laos
-
 Latvia
-
 Lebanon
-
 Lesotho
-
 Libya
-
 Lithuania
-
 Luxembourg
-
 Madagascar
-
 Malaysia
-
 Malta
-
 Mauritius
-
 Mexico
-
 Moldova
-
 Mongolia
-
 Montenegro
-
 Morocco
-
 Mozambique
-
 Myanmar
-
 Namibia
-
 Nepal
-
 Netherlands
-
 New Zealand
-
 Nigeria
-
 North Macedonia
-
 Norway
-
 Oman
-
 Pakistan
-
 Palestine
-
 Panama
-
 Papua New Guinea
-
 Paraguay
-
 Peru
-
 Philippines
-
 Poland
-
 Portugal
-
 Puerto Rico
-
 Qatar
-
 Reunion
-
 Romania
-
 Rwanda
-
 Saudi Arabia
-
 Serbia
-
 Singapore
-
 Slovakia
-
 Slovenia
-
 Somalia
-
 South Africa
-
 Spain
-
 Sri Lanka
-
 Sweden
-
 Switzerland
-
 Syria
-
 Taiwan
-
 Tajikistan
-
 Tanzania
-
 Thailand
-
 Trinidad and Tobago
-
 Tunisia
-
 Turkey
-
 UAE
-
 Uganda
-
 Ukraine
-
 United Kingdom
-
United States
-
 Uruguay
-
 Uzbekistan
-
 Venezuela
-
 Vietnam
-
 Yemen
-
 Zambia
-
 Zimbabwe
- Forex
- Crypto












