

Will Riot Platforms stock hold above $13.12 support amid overbought conditions?

Riot Platforms (RIOT) stock is trading at $13.83, reflecting a daily decline of 4.16%. The price currently sits above its short-term moving averages but remains below longer-term trend markers.
 12.87
14.44
Highlights
- Riot Platforms is scheduled to report earnings on November 4, 2026, an event generating increased market attention for new performance information.
- Riot Platforms has expanded beyond cryptocurrency mining by converting part of its power infrastructure for data center leasing and establishing a revenue stream linked to Bitcoin price swings.
- Shares of Riot Platforms trade at $13.83 with overbought intraday signals, and the expected price range for the next 2 to 3 days is $12.65 to $15.23 as short-term consolidation is anticipated.
Diversification and earnings event drive market caution
Riot Platforms is expected to release its earnings results on November 4, 2026, an event that, according to Gurufocus, has contributed to elevated caution in the market as participants anticipate new performance details. The company has also converted a portion of its power infrastructure to support data center leasing, diversifying operations beyond cryptocurrency mining, according to Foreignpolicyjournal. Additionally, Riot Platforms has developed a secondary revenue stream linked to Bitcoin’s price swings, which may offer some insulation from mining volatility going forward.
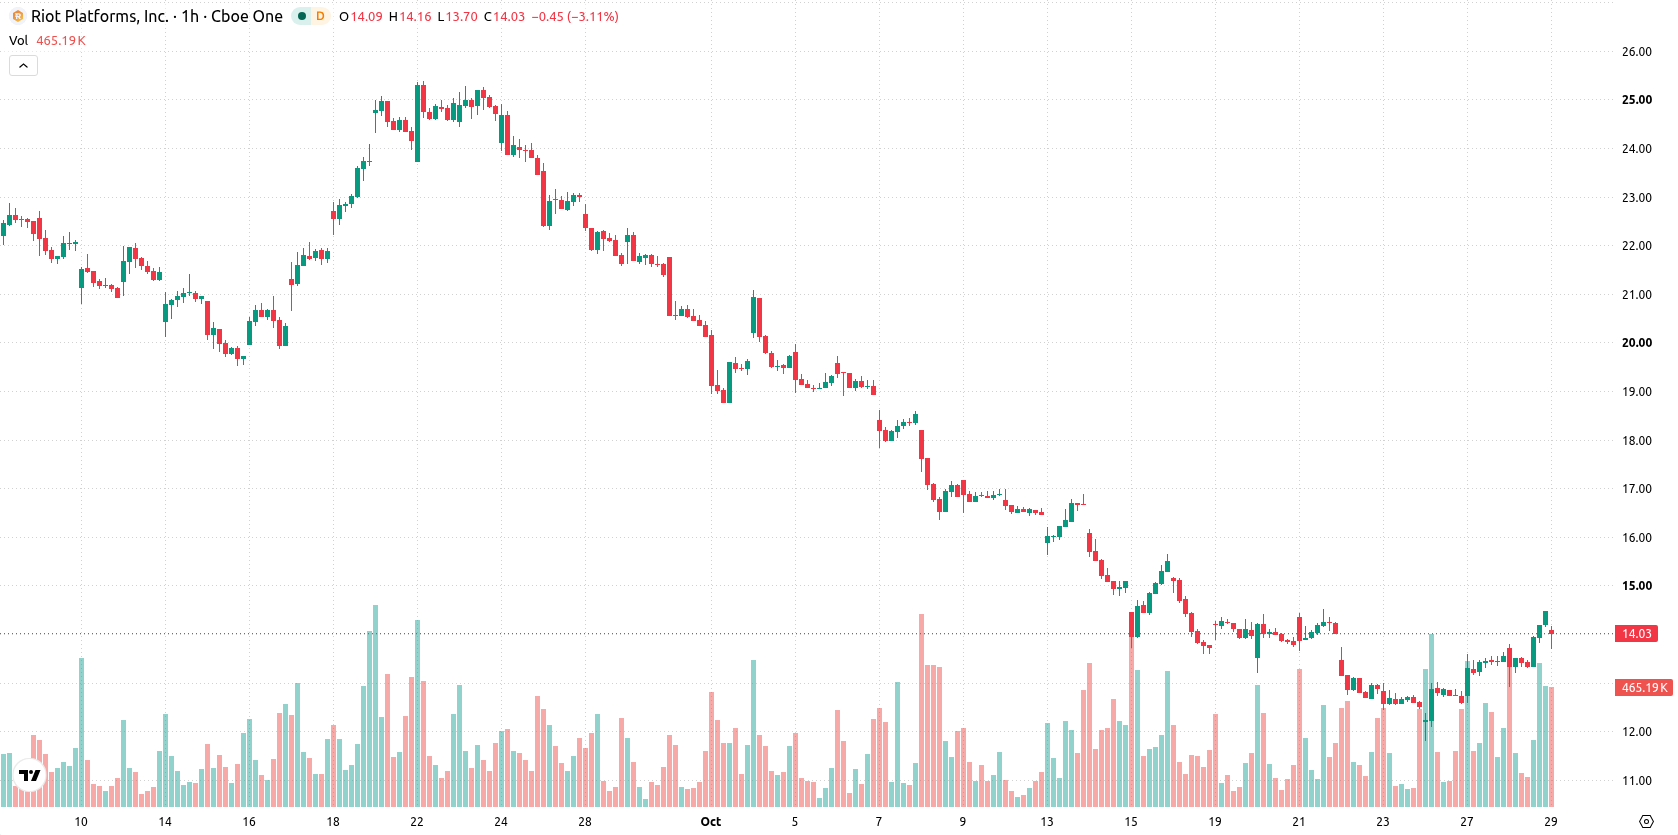
Mixed momentum as intraday support and resistance converge
The MA-20 and MA-50 on the hourly chart are both positioned above the current price, while the MA-200 remains overhead as resistance. The Ichimoku Kijun is observed at $13.12, defining immediate intraday support. On the indicator front, MACD signals buy momentum, whereas ADX remains neutral, reflecting mixed conviction in the trend. Overbought readings from RSI, Stoch RSI, CCI, and Bull/Bear Power point to strong buyer dominance during intraday sessions, a view further supported by the Awesome Oscillator.
Sideways bias as volatility band contains short-term outlook
Looking ahead to the next 2–3 trading days, price action is expected to consolidate within the $12.65 to $15.23 volatility band relative to current levels. Forecast models indicate a 52% probability of an upward move versus 48% to the downside. The baseline scenario anticipates sideways movement in this range. A decisive break above resistance could prompt a move toward the upper boundary, while a drop below immediate support around $13.12 would increase the likelihood of a decline toward recent lows.
Earlier, analysts noted that Riot Platforms was facing predominantly downside risks amid technical challenges and conflicting momentum indicators. The current analysis adds a new dimension by highlighting how recent business diversification and earnings anticipation may help buffer volatility, making $13.12 a key intraday support level to watch in the near term.









-
 Afghanistan
-
 Albania
-
 Algeria
-
 Angola
-
 Argentina
-
 Armenia
-
 Australia
-
 Austria
-
 Azerbaijan
-
 Bahamas
-
 Bahrain
-
 Bangladesh
-
 Belarus
-
 Belgium
-
 Bolivia
-
 Botswana
-
 Brazil
-
 Brunei
-
 Bulgaria
-
 Cambodia
-
 Cameroon
-
 Canada
-
 Chile
-
 China
-
 Colombia
-
 Congo
-
 Costa Rica
-
 Cote d'Ivoire
-
 Croatia
-
 Cuba
-
 Cyprus
-
 Czechia
-
 DR Congo
-
 Denmark
-
 Dominican Republic
-
 Ecuador
-
 Egypt
-
 El Salvador
-
 Estonia
-
 Eswatini
-
 Ethiopia
-
 Finland
-
 France
-
 Georgia
-
 Germany
-
 Ghana
-
 Greece
-
 Haiti
-
 Hong Kong
-
 Hungary
-
 India
-
 Indonesia
-
 Iran, Islamic republic
-
 Iraq
-
 Ireland
-
 Israel
-
 Italy
-
 Jamaica
-
 Japan
-
 Jordan
-
 Kazakhstan
-
 Kenya
-
 Korea
-
 Kuwait
-
 Kyrgyzstan
-
 Laos
-
 Latvia
-
 Lebanon
-
 Lesotho
-
 Libya
-
 Lithuania
-
 Luxembourg
-
 Madagascar
-
 Malaysia
-
 Malta
-
 Mauritius
-
 Mexico
-
 Moldova
-
 Mongolia
-
 Montenegro
-
 Morocco
-
 Mozambique
-
 Myanmar
-
 Namibia
-
 Nepal
-
 Netherlands
-
 New Zealand
-
 Nigeria
-
 North Macedonia
-
 Norway
-
 Oman
-
 Pakistan
-
 Palestine
-
 Panama
-
 Papua New Guinea
-
 Paraguay
-
 Peru
-
 Philippines
-
 Poland
-
 Portugal
-
 Puerto Rico
-
 Qatar
-
 Reunion
-
 Romania
-
 Rwanda
-
 Saudi Arabia
-
 Serbia
-
 Singapore
-
 Slovakia
-
 Slovenia
-
 Somalia
-
 South Africa
-
 Spain
-
 Sri Lanka
-
 Sweden
-
 Switzerland
-
 Syria
-
 Taiwan
-
 Tajikistan
-
 Tanzania
-
 Thailand
-
 Trinidad and Tobago
-
 Tunisia
-
 Turkey
-
 UAE
-
 Uganda
-
 Ukraine
-
 United Kingdom
-
United States
-
 Uruguay
-
 Uzbekistan
-
 Venezuela
-
 Vietnam
-
 Yemen
-
 Zambia
-
 Zimbabwe
- Forex
- Crypto












