

Chevron shares technical analysis: Resistance at $230.86 caps near-term upside

Chevron (CVX) stock is trading at $228.97 after a modest gain today, reflecting a daily move that remains within a narrow range. The price currently sits below its short-term moving average but holds above its medium- and long-term trend markers, signaling limited directional momentum near-term.
 210.16
220.03
Highlights
- ETFs sold $53.4 million of Chevron stock on October 27, 2026 after four days of net buying, reducing institutional exposure.
- The shift in ETF flows may limit further short-term upside in Chevron stock until broader market demand returns.
- Chevron stock faces short-term selling pressure with a 45% chance of gains and expected range of $223.99 to $233.95.
Institutional selling curbs upside amid pause in ETF inflows
On October 27, 2026, ETFs were net sellers of Chevron (CVX), reducing their holdings by $53.4 million following four consecutive days of net buying, according to Gurufocus. This reduction in institutional exposure signals a pause in large-scale buying activity and may translate to softer short-term demand for the stock. Overall, the movement in ETF flows could play a role in capping further gains until broader market appetite returns.
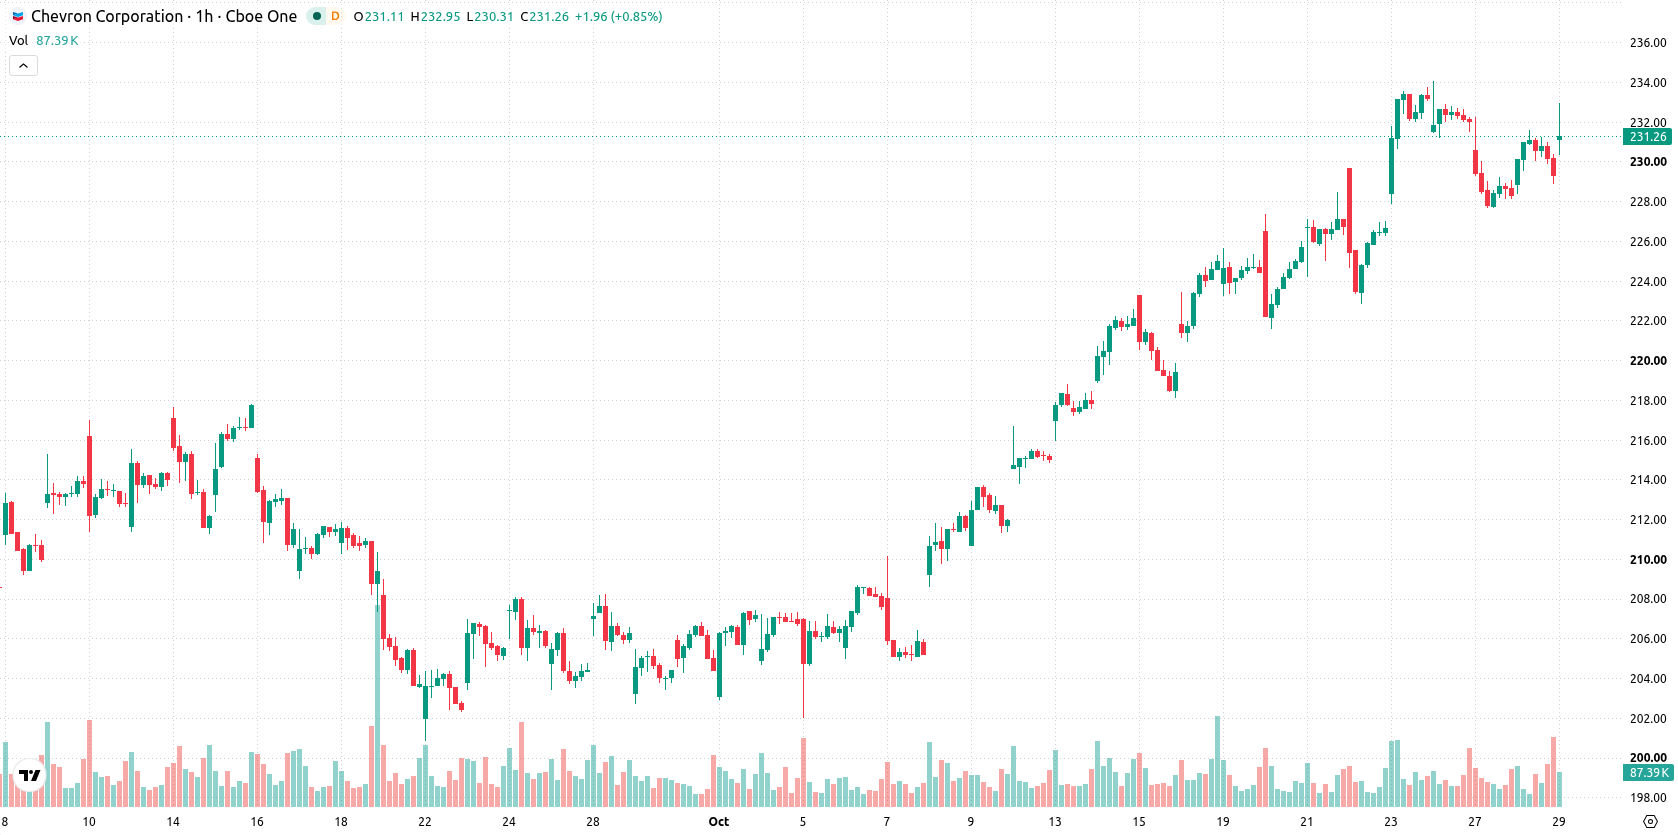
Mixed technical signals as resistance holds and momentum fades
The technical setup for CVX shows the price trading below the MA-20 but maintaining positions above the MA-50 on the hourly chart and clear distance from the MA-200 on the daily. Immediate resistance is at the Ichimoku Kijun level of $230.86. MACD on the H1 shows strong buy momentum, but this is contrasted by ADX indicating waning directional strength. RSI stands at 45.98 with a bias toward selling, CCI is also negative, and Stoch RSI is neutral, together suggesting a market skewed toward oversold conditions. Meanwhile, Bull/Bear Power reflects predominance of sellers in the intraday context.
Downside bias prevails as range-bound trading consolidates
In the near term, CVX is expected to trade within a typical volatility band from $223.99 to $233.95. Current probabilities favor a short-term move lower, with a 55% chance of downside versus 45% for further gains. The most likely scenario involves sideways price action as the market consolidates within this range; an upside breakout would require a move above immediate resistance, while a bearish scenario would play out below the identified support.
Earlier, analysts noted that Chevron’s global asset expansion and restructuring efforts had positioned the stock as resilient during periods of market volatility. The latest reduction in ETF holdings and mixed technical signals now highlight the importance of monitoring the $230.86 resistance level as a gauge for any near-term directional shift.











-
 Afghanistan
-
 Albania
-
 Algeria
-
 Angola
-
 Argentina
-
 Armenia
-
 Australia
-
 Austria
-
 Azerbaijan
-
 Bahamas
-
 Bahrain
-
 Bangladesh
-
 Belarus
-
 Belgium
-
 Bolivia
-
 Botswana
-
 Brazil
-
 Brunei
-
 Bulgaria
-
 Cambodia
-
 Cameroon
-
 Canada
-
 Chile
-
 China
-
 Colombia
-
 Congo
-
 Costa Rica
-
 Cote d'Ivoire
-
 Croatia
-
 Cuba
-
 Cyprus
-
 Czechia
-
 DR Congo
-
 Denmark
-
 Dominican Republic
-
 Ecuador
-
 Egypt
-
 El Salvador
-
 Estonia
-
 Eswatini
-
 Ethiopia
-
 Finland
-
 France
-
 Georgia
-
 Germany
-
 Ghana
-
 Greece
-
 Haiti
-
 Hong Kong
-
 Hungary
-
 India
-
 Indonesia
-
 Iran, Islamic republic
-
 Iraq
-
 Ireland
-
 Israel
-
 Italy
-
 Jamaica
-
 Japan
-
 Jordan
-
 Kazakhstan
-
 Kenya
-
 Korea
-
 Kuwait
-
 Kyrgyzstan
-
 Laos
-
 Latvia
-
 Lebanon
-
 Lesotho
-
 Libya
-
 Lithuania
-
 Luxembourg
-
 Madagascar
-
 Malaysia
-
 Malta
-
 Mauritius
-
 Mexico
-
 Moldova
-
 Mongolia
-
 Montenegro
-
 Morocco
-
 Mozambique
-
 Myanmar
-
 Namibia
-
 Nepal
-
 Netherlands
-
 New Zealand
-
 Nigeria
-
 North Macedonia
-
 Norway
-
 Oman
-
 Pakistan
-
 Palestine
-
 Panama
-
 Papua New Guinea
-
 Paraguay
-
 Peru
-
 Philippines
-
 Poland
-
 Portugal
-
 Puerto Rico
-
 Qatar
-
 Reunion
-
 Romania
-
 Rwanda
-
 Saudi Arabia
-
 Serbia
-
 Singapore
-
 Slovakia
-
 Slovenia
-
 Somalia
-
 South Africa
-
 Spain
-
 Sri Lanka
-
 Sweden
-
 Switzerland
-
 Syria
-
 Taiwan
-
 Tajikistan
-
 Tanzania
-
 Thailand
-
 Trinidad and Tobago
-
 Tunisia
-
 Turkey
-
 UAE
-
 Uganda
-
 Ukraine
-
 United Kingdom
-
United States
-
 Uruguay
-
 Uzbekistan
-
 Venezuela
-
 Vietnam
-
 Yemen
-
 Zambia
-
 Zimbabwe
- Forex
- Crypto












