

Broadcom stock faces volatile setup with 9.5% swings and resistance at $347.14 capping upside: weekly analysis

Shares of Broadcom Inc. (AVGO) are trading near $342 after climbing nearly 7% over the past week. The chart points to a tense setup, with conflicting technical indicators and immediate resistance overhead that could force a consolidation or spark downside risk. As momentum from recent gains faces obstacles, traders will be watching if support can hold in the days ahead.
 331.98
351.95
Highlights
- Shares of Broadcom gained 6.18% over the past week but remain below all key moving averages.
- Technical indicators are mixed with neutral main oscillators but overbought short-term readings and bearish trend signals.
- The trading range is expected between $328.41 and $355.72 this week, with 60% odds skewed to the downside.
Enterprise AI deal lifts sentiment as strategic financing boosts outlook
Broadcom secured a $63 billion financing structure in partnership with Bank of America, Blackstone, Citi, and Morgan Stanley to expand its AI technology deployment for Anthropic, as announced on October 26, 2026, according to PR Newswire. The financing partnership enables the purchase of Broadcom-designed AI equipment, with Broadcom offering residual value support to backstop the arrangement. This deal strengthens AVGO's positioning in the enterprise AI market heading into the week.
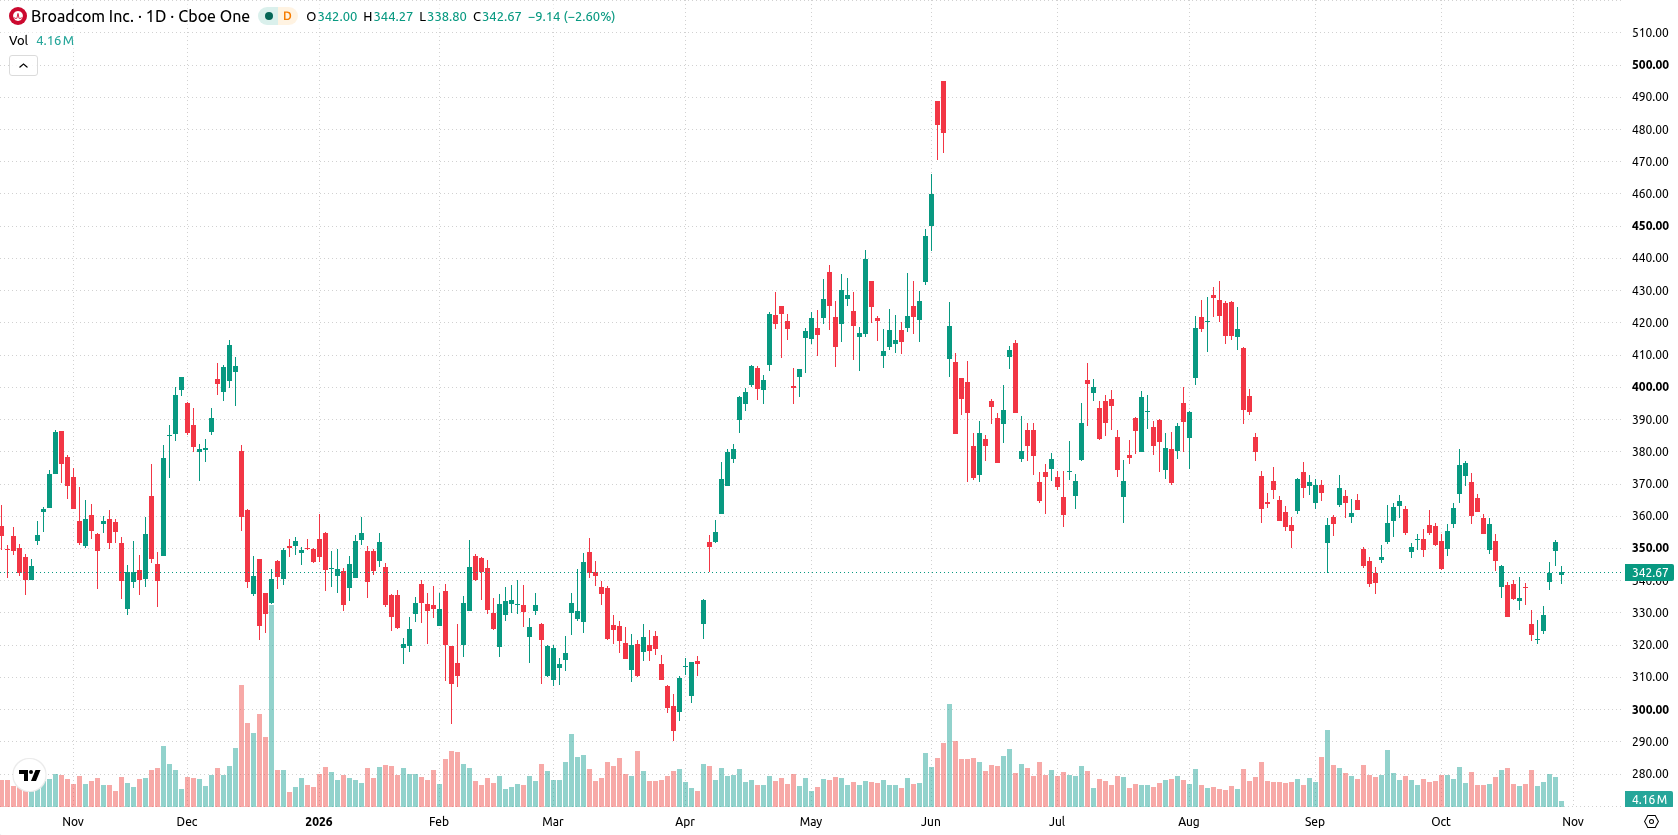
Mixed oscillators and overbought signals highlight correction risk this week
The daily chart reflects a developing trend, shaped by a sharp move higher without a sustained trend, accompanied by 9.5% weekly volatility. Oscillator signals are mixed: while both RSI (52.54) and CCI (10.07) show neutral readings, Stochastic RSI is firmly overbought, signaling near-term overheating and a possible downside correction risk. MACD and ADX are both signaling sell conditions. Support is marked at $321.41, with immediate resistance at $347.14 and the Ichimoku Kijun at $350.97 capping the upside.
Consolidation expected as breakout hinges on Kijun and support levels
In the week ahead, the expected range is $328.41 to $355.72, with a 40% probability of an increase and a 60% likelihood of a decrease. The base case is for consolidation between $321.41 support and $347.14 resistance, with the upside scenario requiring a break above the Kijun at $350.97 to extend gains toward $355.72. If support at $321.41 gives way, the stock could see accelerated downside toward the lower end of the expected range.
In a recent review, analysts highlighted Broadcom's position at the center of enterprise AI expansion while noting mixed technical signals and the importance of key support levels for near-term direction. The current setup adds to this by emphasizing heightened volatility within a well-defined consolidation band, making the next decisive move contingent on a clear break of either the $321.41 support or resistance above $350.97.









-
 Afghanistan
-
 Albania
-
 Algeria
-
 Angola
-
 Argentina
-
 Armenia
-
 Australia
-
 Austria
-
 Azerbaijan
-
 Bahamas
-
 Bahrain
-
 Bangladesh
-
 Belarus
-
 Belgium
-
 Bolivia
-
 Botswana
-
 Brazil
-
 Brunei
-
 Bulgaria
-
 Cambodia
-
 Cameroon
-
 Canada
-
 Chile
-
 China
-
 Colombia
-
 Congo
-
 Costa Rica
-
 Cote d'Ivoire
-
 Croatia
-
 Cuba
-
 Cyprus
-
 Czechia
-
 DR Congo
-
 Denmark
-
 Dominican Republic
-
 Ecuador
-
 Egypt
-
 El Salvador
-
 Estonia
-
 Eswatini
-
 Ethiopia
-
 Finland
-
 France
-
 Georgia
-
 Germany
-
 Ghana
-
 Greece
-
 Haiti
-
 Hong Kong
-
 Hungary
-
 India
-
 Indonesia
-
 Iran, Islamic republic
-
 Iraq
-
 Ireland
-
 Israel
-
 Italy
-
 Jamaica
-
 Japan
-
 Jordan
-
 Kazakhstan
-
 Kenya
-
 Korea
-
 Kuwait
-
 Kyrgyzstan
-
 Laos
-
 Latvia
-
 Lebanon
-
 Lesotho
-
 Libya
-
 Lithuania
-
 Luxembourg
-
 Madagascar
-
 Malaysia
-
 Malta
-
 Mauritius
-
 Mexico
-
 Moldova
-
 Mongolia
-
 Montenegro
-
 Morocco
-
 Mozambique
-
 Myanmar
-
 Namibia
-
 Nepal
-
 Netherlands
-
 New Zealand
-
 Nigeria
-
 North Macedonia
-
 Norway
-
 Oman
-
 Pakistan
-
 Palestine
-
 Panama
-
 Papua New Guinea
-
 Paraguay
-
 Peru
-
 Philippines
-
 Poland
-
 Portugal
-
 Puerto Rico
-
 Qatar
-
 Reunion
-
 Romania
-
 Rwanda
-
 Saudi Arabia
-
 Serbia
-
 Singapore
-
 Slovakia
-
 Slovenia
-
 Somalia
-
 South Africa
-
 Spain
-
 Sri Lanka
-
 Sweden
-
 Switzerland
-
 Syria
-
 Taiwan
-
 Tajikistan
-
 Tanzania
-
 Thailand
-
 Trinidad and Tobago
-
 Tunisia
-
 Turkey
-
 UAE
-
 Uganda
-
 Ukraine
-
 United Kingdom
-
United States
-
 Uruguay
-
 Uzbekistan
-
 Venezuela
-
 Vietnam
-
 Yemen
-
 Zambia
-
 Zimbabwe
- Forex
- Crypto












