

Will Tesla stock extend gains amid overbought conditions and heavy investment concerns?

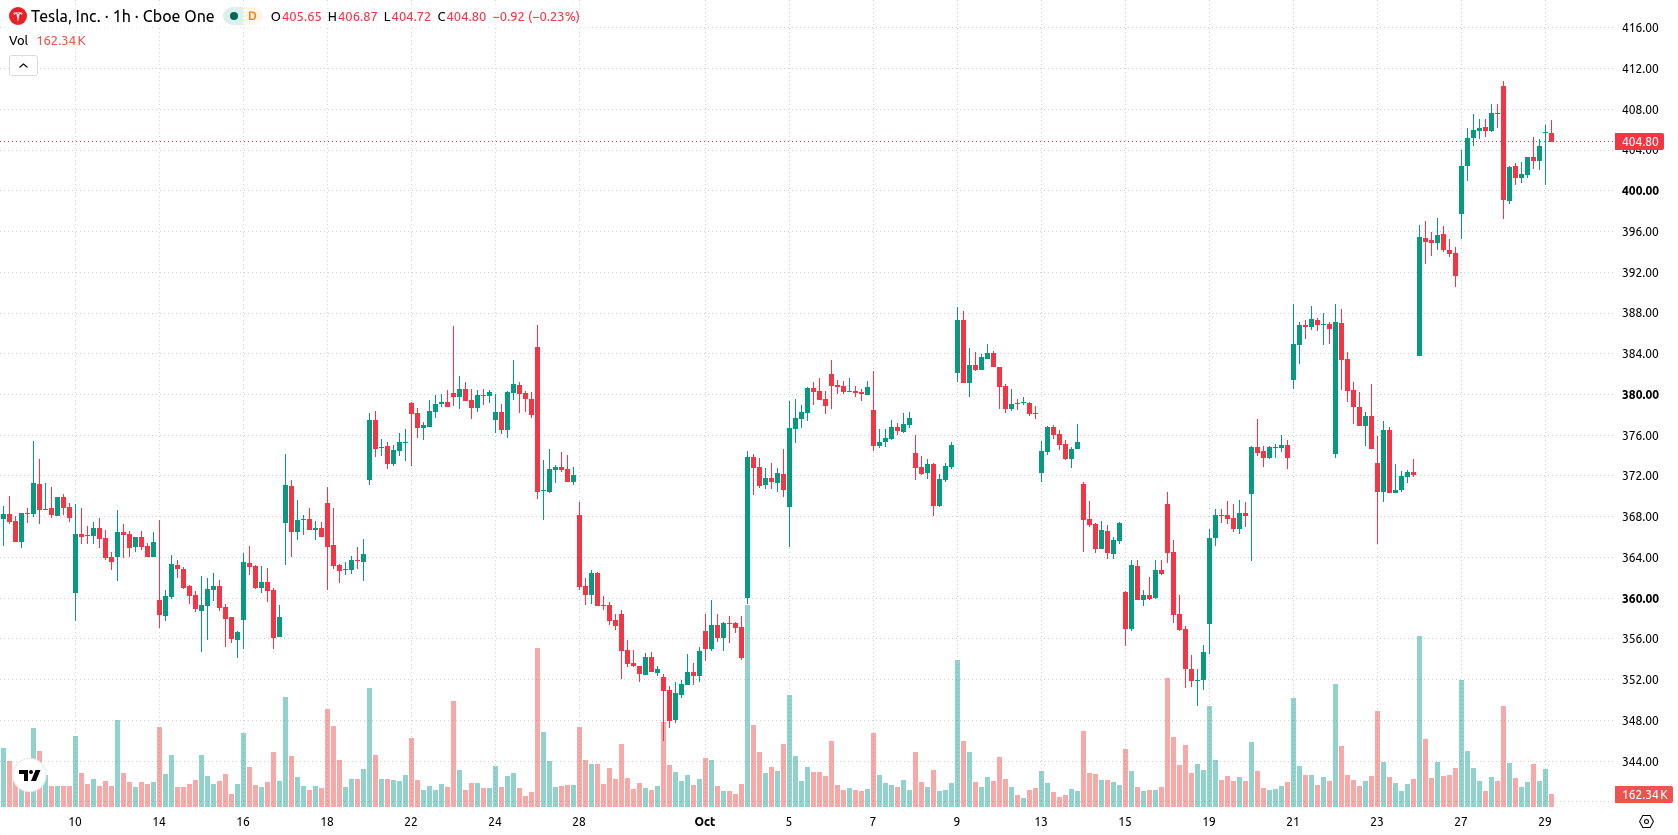
Tesla (TSLA) stock is trading at $404.96 after edging modestly higher in today’s session. The price sits above its key moving averages, indicating support from both short- and long-term trends.
 403.82
408.36
Highlights
- Tesla stock saw GAAP net income drop 43% year on year to $787 million in Q3 2026, with operating profit down 56% to $718 million and continued margin pressure.
- Free cash flow reached $1.53 billion due to $3 billion lower capital expenditures, while investment in capacity drove a capex increase to $4.73 billion versus last year.
- Tesla stock trades with strong short- and medium-term bullish signals, expected to move in a $385.76 to $424.16 range over the next several days.
Profitability concerns mount as capex surges despite margin pressure
Tesla's third-quarter 2026 earnings report revealed a 43% year-on-year drop in GAAP net income to $787 million, with operating profit falling 56% to $718 million on revenue of $28.05 billion, highlighting continued margin pressure and shifting demand, as reported by Finance Biggo. Free cash flow reached $1.53 billion last quarter, though this was primarily due to $3 billion less in capital expenditures than anticipated rather than stronger operating performance, according to Yahoo Finance. Capital expenditure more than doubled over the prior year to $4.73 billion, marking a heavy investment cycle that raises short-term profitability concerns while supporting long-term capacity, according to Fool. Additionally, a Seoul court recently ruled against Tesla owners seeking Full Self-Driving refunds, resolving a regulatory dispute with minimal financial impact, according to Gurufocus.
Technical indicators highlight buyer dominance amid overbought signals
In technical terms, TSLA trades above the MA-20 and MA-50 on the hourly chart and holds above its MA-200 daily level, with the Ichimoku Kijun at $390.62 providing immediate support. MACD signals Strong Buy and ADX points to a Buy, while RSI and Stoch RSI both remain in buy territory; CCI is neutral. Bull/Bear Power is currently overbought, indicating strong buyer dominance, whereas the Awesome Oscillator is neutral and does not reinforce the prevailing trend.
Price consolidation likely as upside breakout risk increases
Over the next few days, TSLA is expected to consolidate between $385.76 and $424.16, a typical volatility band relative to current levels. The baseline scenario sees the price ranging between immediate support and resistance, although the probability of an upward move is very high while the risk of a downside reversal remains low. A sustained break above the upper end of the range could trigger further gains, while a sustained move below support might prompt sharper declines.
Previously it was reported that a Seoul court rejected Tesla owners' claims for Full Self-Driving refunds, finding no breach of the company's sales commitments. With the stock trading above its major moving averages and technical signals pointing to strong buyer dominance, traders should closely monitor the $424.16 resistance level for confirmation of further upside momentum.











-
 Afghanistan
-
 Albania
-
 Algeria
-
 Angola
-
 Argentina
-
 Armenia
-
 Australia
-
 Austria
-
 Azerbaijan
-
 Bahamas
-
 Bahrain
-
 Bangladesh
-
 Belarus
-
 Belgium
-
 Bolivia
-
 Botswana
-
 Brazil
-
 Brunei
-
 Bulgaria
-
 Cambodia
-
 Cameroon
-
 Canada
-
 Chile
-
 China
-
 Colombia
-
 Congo
-
 Costa Rica
-
 Cote d'Ivoire
-
 Croatia
-
 Cuba
-
 Cyprus
-
 Czechia
-
 DR Congo
-
 Denmark
-
 Dominican Republic
-
 Ecuador
-
 Egypt
-
 El Salvador
-
 Estonia
-
 Eswatini
-
 Ethiopia
-
 Finland
-
 France
-
 Georgia
-
 Germany
-
 Ghana
-
 Greece
-
 Haiti
-
 Hong Kong
-
 Hungary
-
 India
-
 Indonesia
-
 Iran, Islamic republic
-
 Iraq
-
 Ireland
-
 Israel
-
 Italy
-
 Jamaica
-
 Japan
-
 Jordan
-
 Kazakhstan
-
 Kenya
-
 Korea
-
 Kuwait
-
 Kyrgyzstan
-
 Laos
-
 Latvia
-
 Lebanon
-
 Lesotho
-
 Libya
-
 Lithuania
-
 Luxembourg
-
 Madagascar
-
 Malaysia
-
 Malta
-
 Mauritius
-
 Mexico
-
 Moldova
-
 Mongolia
-
 Montenegro
-
 Morocco
-
 Mozambique
-
 Myanmar
-
 Namibia
-
 Nepal
-
 Netherlands
-
 New Zealand
-
 Nigeria
-
 North Macedonia
-
 Norway
-
 Oman
-
 Pakistan
-
 Palestine
-
 Panama
-
 Papua New Guinea
-
 Paraguay
-
 Peru
-
 Philippines
-
 Poland
-
 Portugal
-
 Puerto Rico
-
 Qatar
-
 Reunion
-
 Romania
-
 Rwanda
-
 Saudi Arabia
-
 Serbia
-
 Singapore
-
 Slovakia
-
 Slovenia
-
 Somalia
-
 South Africa
-
 Spain
-
 Sri Lanka
-
 Sweden
-
 Switzerland
-
 Syria
-
 Taiwan
-
 Tajikistan
-
 Tanzania
-
 Thailand
-
 Trinidad and Tobago
-
 Tunisia
-
 Turkey
-
 UAE
-
 Uganda
-
 Ukraine
-
 United Kingdom
-
United States
-
 Uruguay
-
 Uzbekistan
-
 Venezuela
-
 Vietnam
-
 Yemen
-
 Zambia
-
 Zimbabwe
- Forex
- Crypto












