

What's behind United Airlines's latest 3.3% stock surge?

United Airlines Holdings (UAL) jumped 3.33% after reporting record revenue growth that outweighed a soft earnings forecast and ongoing margin pressure from rising fuel and labor costs. The advance looks limited, as the stock remains below both its 50-day and 200-day moving averages despite short-term bullish momentum above the 20-day level.
 113.24
121.46
Highlights
- United Airlines posted third-quarter 2026 revenue growth of 17%, reaching record levels, but earnings per share fell 8.6% year-over-year and missed consensus.
- Fourth-quarter earnings guidance came in below Wall Street expectations as higher fuel and labor costs, schedule adjustments, and heavy fleet investment restricted cash flexibility.
- Shares of United Airlines trade above short-term support and exhibit bullish intraday momentum, but most indicators signal a bearish or neutral trend with expected consolidation between $102.16 and $111.31.
Record revenue growth tempered by weak outlook and rising expenses
United Airlines reported mixed third-quarter 2026 results, with earnings per share decreasing 8.6% year-over-year and missing consensus estimates, while revenue hit record levels with 17% growth. Pre-tax earnings reached $1.3 billion with a 7.3% margin, and adjusted pre-tax earnings were $1.1 billion at a 6.2% margin. The company issued a fourth-quarter earnings forecast below Wall Street expectations, highlighting higher fuel and labor costs, schedule changes, and heavy fleet investments as factors constraining cash flexibility. United and Air Canada also progressed toward a joint business agreement on Canada–U.S. routes, subject to regulatory review and concerns about its potential impact on fares.
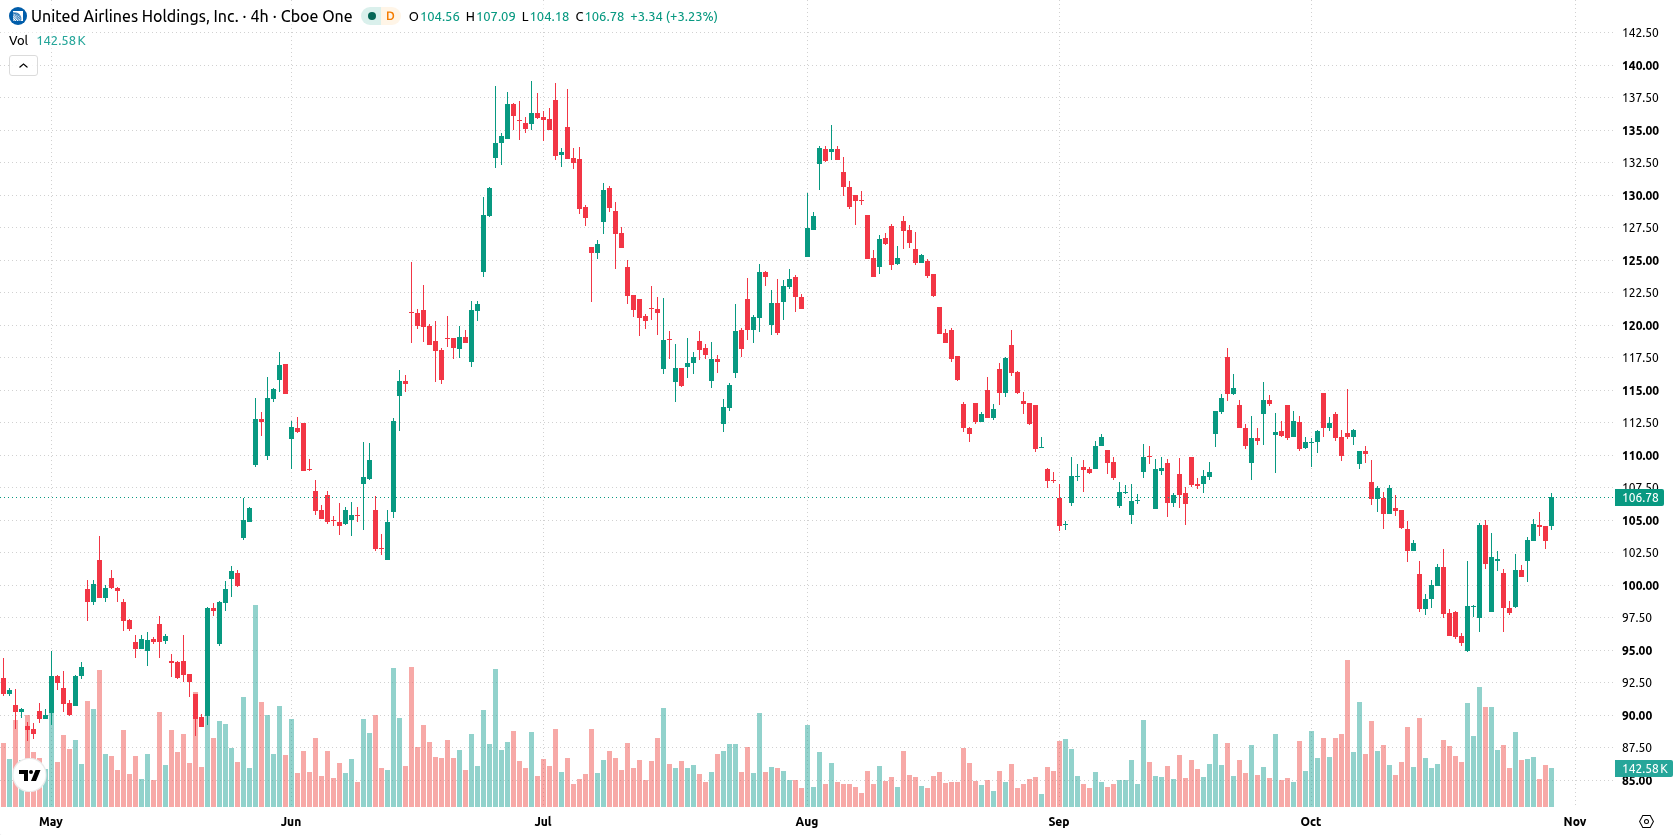
Bullish intraday surge meets resistance amid mixed momentum signals
United Airlines is trading above the 20-day moving average at $103.96, but remains below both the 50-day and 200-day levels at $108.01 and $108.13, indicating short-term bullish momentum but medium- to long-term resistance and bearish technical alignment. The nearest resistance is at $108.01, with immediate support at $105.6 and additional backing from the Ichimoku Kijun at $105.21. Momentum signals are mixed: the MACD points to strong selling pressure, the ADX is neutral, the RSI shows a sell bias at 47.85 (not yet overbought), the Stochastic RSI is elevated at 90.28 signaling overbought conditions, the CCI is neutral, and the Bull/Bear Power indicator is positive at 3.31, showing intraday buyer dominance in an overbought context. The stock is up $3.44 or 3.33%, having gapped higher by about 1.2%, and is trading near its session highs amid 2.75% intraday volatility. Price strength is clustered near the session peak, highlighting a divergence between strong intraday buying and several bearish or neutral momentum indicators.
Earlier, analysts noted that United Airlines was facing mixed technical signals, with gains restrained by ongoing resistance despite strong short-term buying. The latest data adds depth to this view, as persistent medium- and long-term resistance now underscores the importance of monitoring the $108.01 barrier for any potential upside breakout in the coming sessions.






Latest United Airlines News



-
 Afghanistan
-
 Albania
-
 Algeria
-
 Angola
-
 Argentina
-
 Armenia
-
 Australia
-
 Austria
-
 Azerbaijan
-
 Bahamas
-
 Bahrain
-
 Bangladesh
-
 Belarus
-
 Belgium
-
 Bolivia
-
 Botswana
-
 Brazil
-
 Brunei
-
 Bulgaria
-
 Cambodia
-
 Cameroon
-
 Canada
-
 Chile
-
 China
-
 Colombia
-
 Congo
-
 Costa Rica
-
 Cote d'Ivoire
-
 Croatia
-
 Cuba
-
 Cyprus
-
 Czechia
-
 DR Congo
-
 Denmark
-
 Dominican Republic
-
 Ecuador
-
 Egypt
-
 El Salvador
-
 Estonia
-
 Eswatini
-
 Ethiopia
-
 Finland
-
 France
-
 Georgia
-
 Germany
-
 Ghana
-
 Greece
-
 Haiti
-
 Hong Kong
-
 Hungary
-
 India
-
 Indonesia
-
 Iran, Islamic republic
-
 Iraq
-
 Ireland
-
 Israel
-
 Italy
-
 Jamaica
-
 Japan
-
 Jordan
-
 Kazakhstan
-
 Kenya
-
 Korea
-
 Kuwait
-
 Kyrgyzstan
-
 Laos
-
 Latvia
-
 Lebanon
-
 Lesotho
-
 Libya
-
 Lithuania
-
 Luxembourg
-
 Madagascar
-
 Malaysia
-
 Malta
-
 Mauritius
-
 Mexico
-
 Moldova
-
 Mongolia
-
 Montenegro
-
 Morocco
-
 Mozambique
-
 Myanmar
-
 Namibia
-
 Nepal
-
 Netherlands
-
 New Zealand
-
 Nigeria
-
 North Macedonia
-
 Norway
-
 Oman
-
 Pakistan
-
 Palestine
-
 Panama
-
 Papua New Guinea
-
 Paraguay
-
 Peru
-
 Philippines
-
 Poland
-
 Portugal
-
 Puerto Rico
-
 Qatar
-
 Reunion
-
 Romania
-
 Rwanda
-
 Saudi Arabia
-
 Serbia
-
 Singapore
-
 Slovakia
-
 Slovenia
-
 Somalia
-
 South Africa
-
 Spain
-
 Sri Lanka
-
 Sweden
-
 Switzerland
-
 Syria
-
 Taiwan
-
 Tajikistan
-
 Tanzania
-
 Thailand
-
 Trinidad and Tobago
-
 Tunisia
-
 Turkey
-
 UAE
-
 Uganda
-
 Ukraine
-
 United Kingdom
-
United States
-
 Uruguay
-
 Uzbekistan
-
 Venezuela
-
 Vietnam
-
 Yemen
-
 Zambia
-
 Zimbabwe
- Forex
- Crypto












