

JetBlue Airways CEO bankruptcy denial lifts outlook: Can JBLU continue gains?

JetBlue Airways (JBLU) stock is trading at $2.99, up 4.74% on the day. The price sits above its key short- and medium-term moving averages, reflecting near-term upside momentum.
 3.97
3.77
Highlights
- JetBlue CEO Joanna Geraghty publicly denied any restructuring or bankruptcy talks, reducing uncertainty and immediate insolvency fears for the stock.
- JetBlue reported a third-quarter 2026 net loss of $257 million and maintained $2.2 billion in liquidity, indicating ongoing financial pressure with stable cash reserves.
- Shares of JetBlue gained 4.74% to $2.99, showing short- and medium-term upside momentum with an expected trading range of $2.67 to $3.31, while the long-term trend remains bearish.
Insolvency fears ease as CEO dismisses bankruptcy talk amid losses
JetBlue CEO Joanna Geraghty’s public denial of restructuring and bankruptcy discussions directly addresses recent market speculation and removes a significant source of uncertainty, as reported by Airlinegeeks and Finance Biggo. This authoritative statement has immediately reduced insolvency fears, encouraging renewed demand for the stock. Concurrently, JetBlue reported a net loss of $257 million for the third quarter of 2026 and maintained $2.2 billion in liquidity, according to Yahoo Finance, signaling both financial strain and continued operational viability.
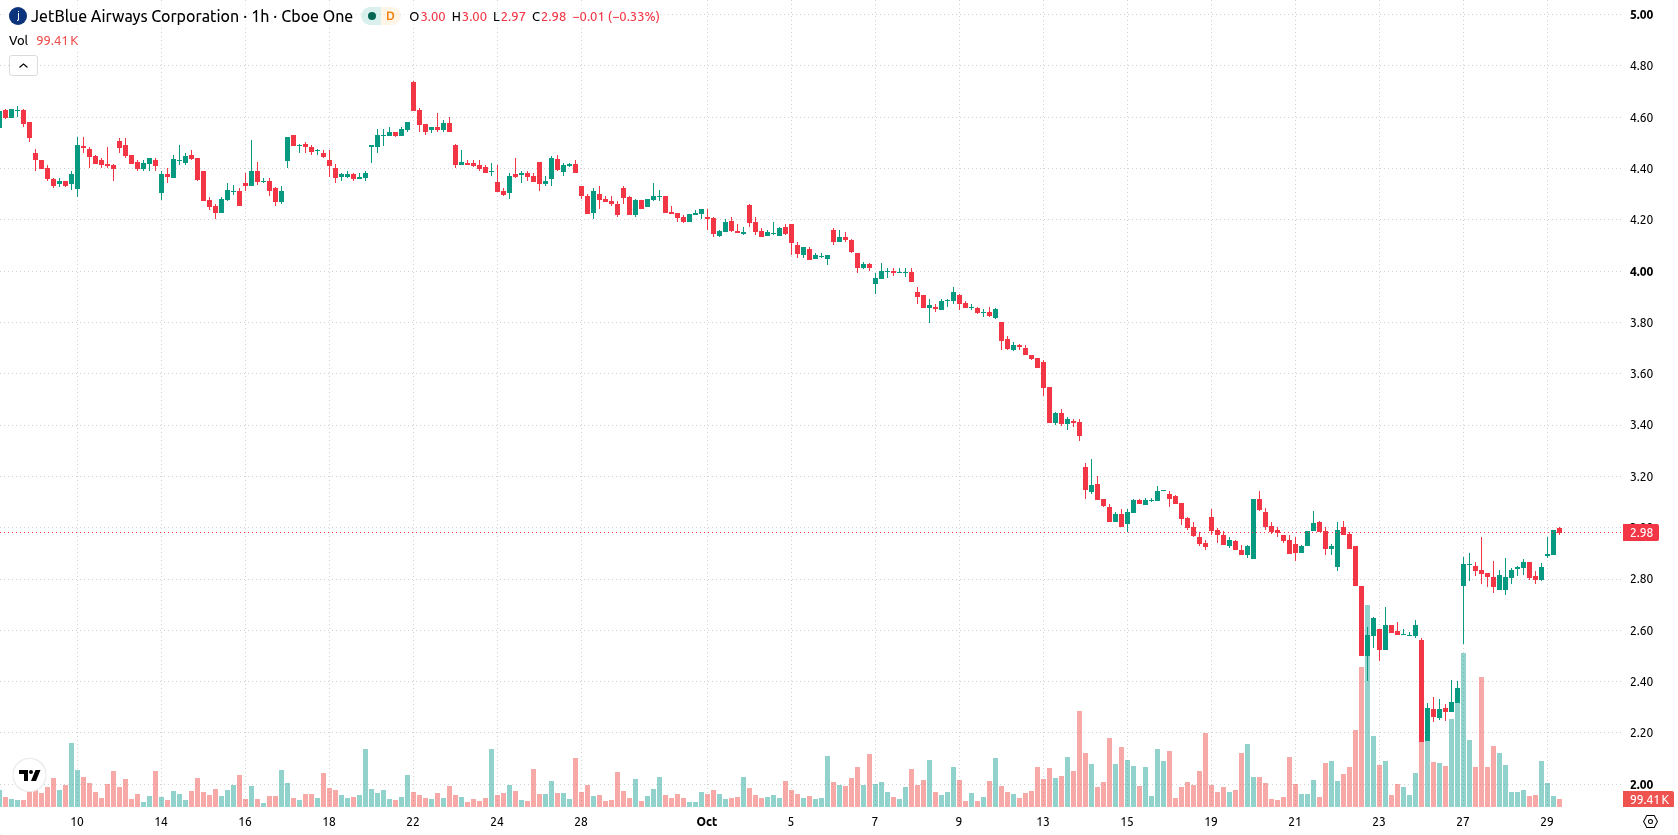
Bullish hourly signals strengthen above support despite long-term cap
On the h1 chart, JBLU is trading above both the MA-20 at $2.67 and the MA-50 at $2.75, while the daily price remains below the long-term MA-200 at $4.94. The immediate support is marked by the Ichimoku Kijun level at $2.53, with the expected short-term support around $2.67 and resistance near $3.31. Momentum indicators on the h1 timeframe, including MACD, ADX, CCI, Bull/Bear Power, and Awesome Oscillator, all show bullish readings. RSI stands at 57.79, in buy territory, CCI is also positive, and Stochastic RSI is neutral, pointing toward a brief pause in momentum rather than any overbought signal.
Gains favored as range narrows with breakout potential
In the short term, JBLU is expected to trade within the $2.67 to $3.31 range, with probability skewed toward further gains (up probability 78%, down probability 22%). If price breaks above the $3.31 resistance, a bullish extension toward the upper band is likely; if it falls below support at $2.67, a retracement toward the Ichimoku Kijun near $2.53 could follow. The baseline scenario anticipates continued sideways movement inside this volatility band relative to current levels.
Previously it was reported that JetBlue faced persistent financial pressures and elevated downside risk as creditors took measures to address potential insolvency. The current article strengthens this outlook by noting bullish short-term technical signals but emphasizes that the $2.67 support and $3.31 resistance are key levels to monitor for signs of either continued upside or a potential retracement.









-
 Afghanistan
-
 Albania
-
 Algeria
-
 Angola
-
 Argentina
-
 Armenia
-
 Australia
-
 Austria
-
 Azerbaijan
-
 Bahamas
-
 Bahrain
-
 Bangladesh
-
 Belarus
-
 Belgium
-
 Bolivia
-
 Botswana
-
 Brazil
-
 Brunei
-
 Bulgaria
-
 Cambodia
-
 Cameroon
-
 Canada
-
 Chile
-
 China
-
 Colombia
-
 Congo
-
 Costa Rica
-
 Cote d'Ivoire
-
 Croatia
-
 Cuba
-
 Cyprus
-
 Czechia
-
 DR Congo
-
 Denmark
-
 Dominican Republic
-
 Ecuador
-
 Egypt
-
 El Salvador
-
 Estonia
-
 Eswatini
-
 Ethiopia
-
 Finland
-
 France
-
 Georgia
-
 Germany
-
 Ghana
-
 Greece
-
 Haiti
-
 Hong Kong
-
 Hungary
-
 India
-
 Indonesia
-
 Iran, Islamic republic
-
 Iraq
-
 Ireland
-
 Israel
-
 Italy
-
 Jamaica
-
 Japan
-
 Jordan
-
 Kazakhstan
-
 Kenya
-
 Korea
-
 Kuwait
-
 Kyrgyzstan
-
 Laos
-
 Latvia
-
 Lebanon
-
 Lesotho
-
 Libya
-
 Lithuania
-
 Luxembourg
-
 Madagascar
-
 Malaysia
-
 Malta
-
 Mauritius
-
 Mexico
-
 Moldova
-
 Mongolia
-
 Montenegro
-
 Morocco
-
 Mozambique
-
 Myanmar
-
 Namibia
-
 Nepal
-
 Netherlands
-
 New Zealand
-
 Nigeria
-
 North Macedonia
-
 Norway
-
 Oman
-
 Pakistan
-
 Palestine
-
 Panama
-
 Papua New Guinea
-
 Paraguay
-
 Peru
-
 Philippines
-
 Poland
-
 Portugal
-
 Puerto Rico
-
 Qatar
-
 Reunion
-
 Romania
-
 Rwanda
-
 Saudi Arabia
-
 Serbia
-
 Singapore
-
 Slovakia
-
 Slovenia
-
 Somalia
-
 South Africa
-
 Spain
-
 Sri Lanka
-
 Sweden
-
 Switzerland
-
 Syria
-
 Taiwan
-
 Tajikistan
-
 Tanzania
-
 Thailand
-
 Trinidad and Tobago
-
 Tunisia
-
 Turkey
-
 UAE
-
 Uganda
-
 Ukraine
-
 United Kingdom
-
United States
-
 Uruguay
-
 Uzbekistan
-
 Venezuela
-
 Vietnam
-
 Yemen
-
 Zambia
-
 Zimbabwe
- Forex
- Crypto












