

Morgan Stanley stock extends downward price move as short-term exhaustion slows further selling

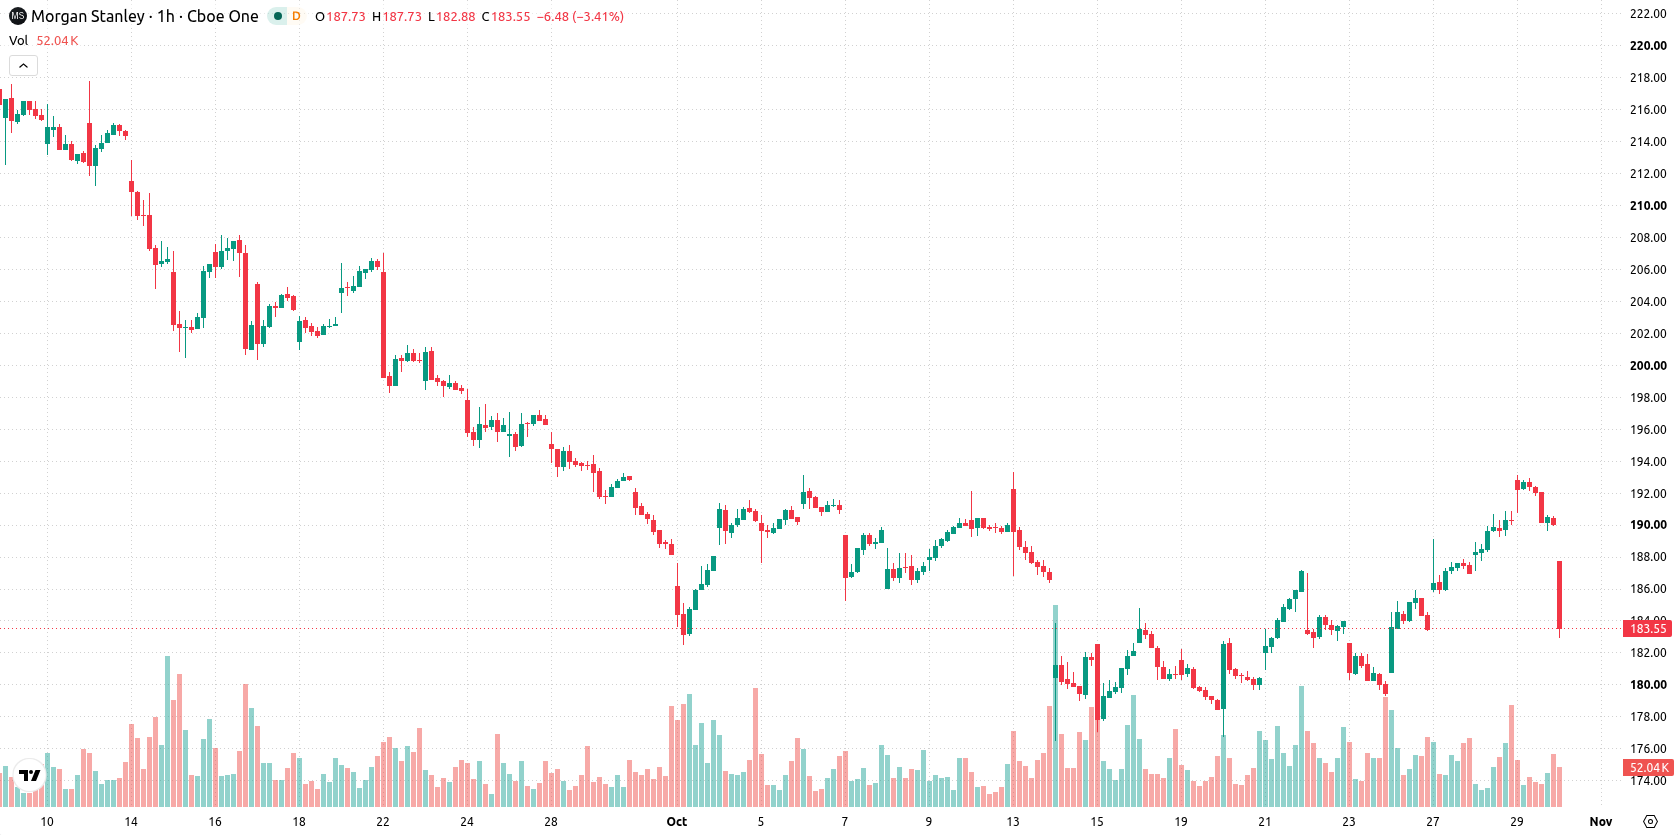
Morgan Stanley (MS) stock is trading at $184.67, down 2.82% for the day, and is positioned below its key short-, medium-, and long-term moving averages.
 186.99
193.06
Highlights
- Morgan Stanley declared a $1.15 quarterly dividend, set for payment on November 13, with an annualized yield of 2.42% at $190.13.
- The ex-dividend date is October 30, 2026, establishing a future income event for shareholders and reinforcing Morgan Stanley's focus on capital returns.
- Shares of Morgan Stanley trade below key moving averages with persistent selling pressure, expected to fluctuate between $179.35 and $189.99 in the next 2 to 3 days.
Dividend announcement boosts yield appeal despite lingering price weakness
Morgan Stanley has declared a $1.15 quarterly dividend, with the ex-dividend date set for October 30, 2026, and payment scheduled for November 13, according to Dividendchannel. This announcement sets a future income event for shareholders and highlights the company's ongoing commitment to capital returns, offering an annualized yield of 2.42% at a reference price of $190.13. Such dividend declarations can attract income-oriented investors and anchor near-term yield expectations, though price action has remained under broader selling pressure.
Downside momentum persists as momentum signals diverge at resistance
On the hourly chart, MS is trading below its MA-20 at $189.45, MA-50 at $185.76, and MA-200 at $194.31, indicating sustained downside momentum across all major time horizons. The Ichimoku Kijun at $188.23 serves as the nearest resistance level for potential rebounds. Momentum signals present a mixed picture: MACD indicates Strong Buy and ADX signals Buy, pointing to underlying positive momentum; RSI stands at 57.76 in Buy territory, while Bull/Bear Power suggests buyers dominate intraday. However, CCI is Neutral, Stochastic RSI is Oversold, and the Awesome Oscillator is Neutral, pointing to short-term exhaustion and a divergence between directional and oscillator indicators.
Consolidation likely as directional risk depends on technical breakout
In the near term, MS is likely to consolidate between $179.35 and $189.99, with a 61% probability of an upward move relative to downside risk. The baseline scenario is continued range-bound trading within this volatility band. A decisive break above $188.23 could trigger fresh buying pressure, while a drop below $179.35 would signal an acceleration of short-term losses.
Earlier, analysts noted that while Morgan Stanley’s strong fundamentals were offset by persistent technical headwinds, the stock was expected to remain range-bound until a clear directional signal emerged. The current technical setup continues to highlight consolidation risk, with a break above $188.23 serving as a potential inflection point for renewed buying momentum.










-
 Afghanistan
-
 Albania
-
 Algeria
-
 Angola
-
 Argentina
-
 Armenia
-
 Australia
-
 Austria
-
 Azerbaijan
-
 Bahamas
-
 Bahrain
-
 Bangladesh
-
 Belarus
-
 Belgium
-
 Bolivia
-
 Botswana
-
 Brazil
-
 Brunei
-
 Bulgaria
-
 Cambodia
-
 Cameroon
-
 Canada
-
 Chile
-
 China
-
 Colombia
-
 Congo
-
 Costa Rica
-
 Cote d'Ivoire
-
 Croatia
-
 Cuba
-
 Cyprus
-
 Czechia
-
 DR Congo
-
 Denmark
-
 Dominican Republic
-
 Ecuador
-
 Egypt
-
 El Salvador
-
 Estonia
-
 Eswatini
-
 Ethiopia
-
 Finland
-
 France
-
 Georgia
-
 Germany
-
 Ghana
-
 Greece
-
 Haiti
-
 Hong Kong
-
 Hungary
-
 India
-
 Indonesia
-
 Iran, Islamic republic
-
 Iraq
-
 Ireland
-
 Israel
-
 Italy
-
 Jamaica
-
 Japan
-
 Jordan
-
 Kazakhstan
-
 Kenya
-
 Korea
-
 Kuwait
-
 Kyrgyzstan
-
 Laos
-
 Latvia
-
 Lebanon
-
 Lesotho
-
 Libya
-
 Lithuania
-
 Luxembourg
-
 Madagascar
-
 Malaysia
-
 Malta
-
 Mauritius
-
 Mexico
-
 Moldova
-
 Mongolia
-
 Montenegro
-
 Morocco
-
 Mozambique
-
 Myanmar
-
 Namibia
-
 Nepal
-
 Netherlands
-
 New Zealand
-
 Nigeria
-
 North Macedonia
-
 Norway
-
 Oman
-
 Pakistan
-
 Palestine
-
 Panama
-
 Papua New Guinea
-
 Paraguay
-
 Peru
-
 Philippines
-
 Poland
-
 Portugal
-
 Puerto Rico
-
 Qatar
-
 Reunion
-
 Romania
-
 Rwanda
-
 Saudi Arabia
-
 Serbia
-
 Singapore
-
 Slovakia
-
 Slovenia
-
 Somalia
-
 South Africa
-
 Spain
-
 Sri Lanka
-
 Sweden
-
 Switzerland
-
 Syria
-
 Taiwan
-
 Tajikistan
-
 Tanzania
-
 Thailand
-
 Trinidad and Tobago
-
 Tunisia
-
 Turkey
-
 UAE
-
 Uganda
-
 Ukraine
-
 United Kingdom
-
United States
-
 Uruguay
-
 Uzbekistan
-
 Venezuela
-
 Vietnam
-
 Yemen
-
 Zambia
-
 Zimbabwe
- Forex
- Crypto












