

Will Texas Instruments stock avoid deeper losses amid weak momentum?

Texas Instruments (TXN) stock is trading at $301.46, down 3.66% on the day and holding near the session's low. The price is currently below its short-term moving average but remains above key medium- and long-term averages.
 308.00
313.07
Highlights
- Texas Instruments increased its quarterly dividend to $1.52 per share, with ex-dividend date set for October 30, 2026.
- The dividend hike raises projected shareholder returns and may indicate an adjustment in capital allocation supporting long-term valuation.
- Shares of Texas Instruments are under short-term selling pressure, with price expected to range from $288.76 to $314.16 and mixed momentum signals showing prevailing intraday weakness.
Dividend hike supports long-term outlook amid persistent sell pressure
Texas Instruments has recently increased its quarterly dividend to $1.52 per share, with the new ex-dividend date set for October 30, 2026, according to Gurufocus. This confirmed action boosts projected shareholder returns and may signal a shift in capital allocation, which is generally interpreted as supportive for long-term valuation. However, these developments have occurred while price action has remained under broader selling pressure.
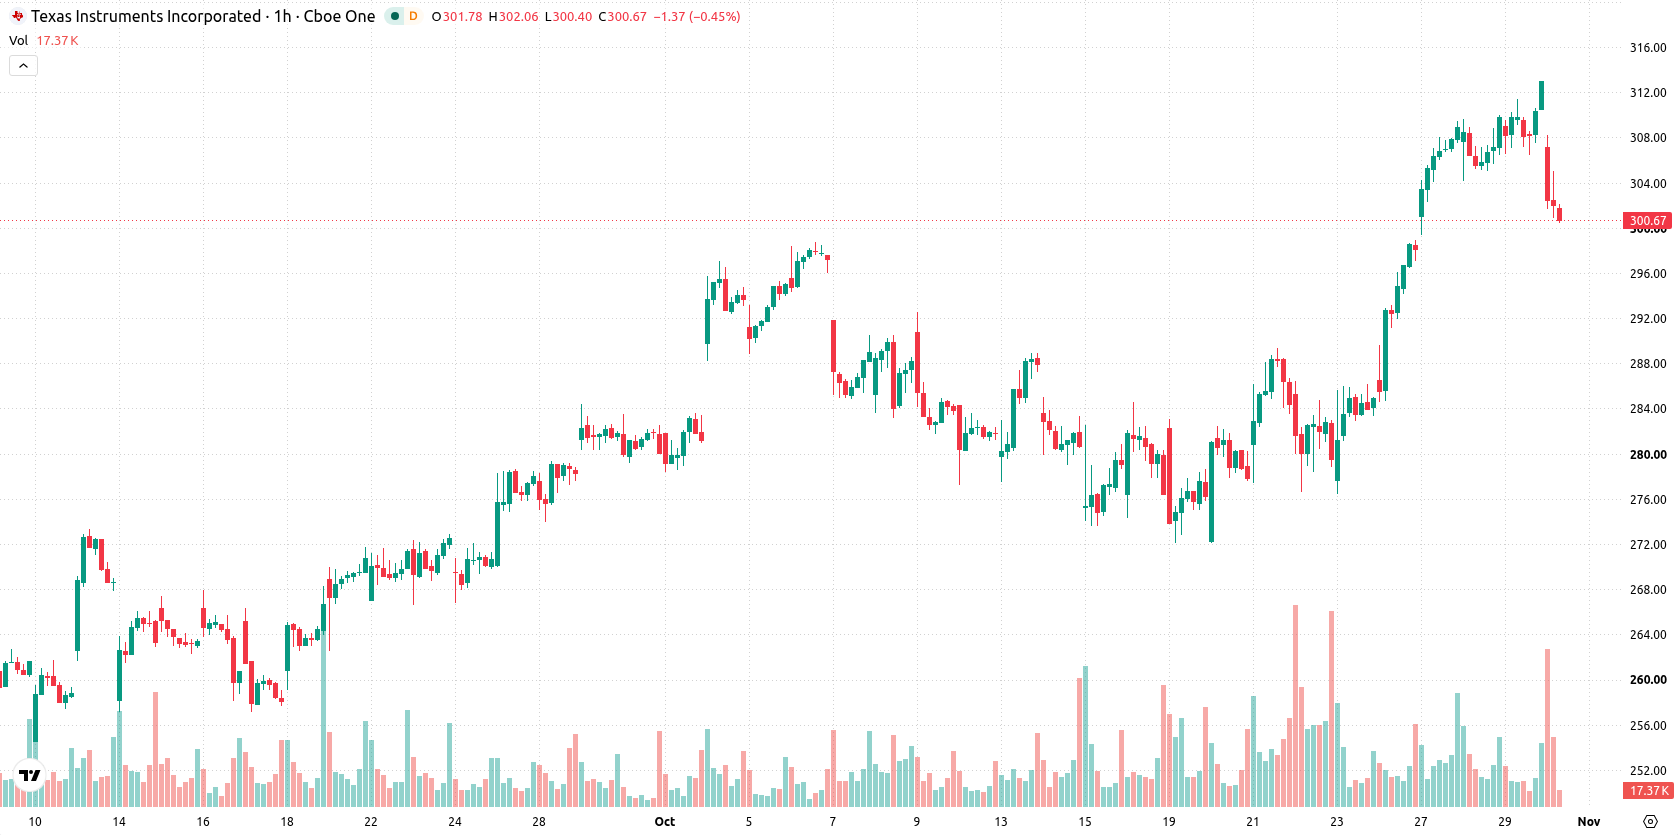
Conflicting momentum signals persist as critical resistance contains price
Technically, TXN/USD is trading below the MA-20 while holding above both the MA-50 and MA-200. The Ichimoku Kijun lines up at $303.59 and stands as immediate resistance for price action. On momentum, MACD is positioned on a strong buy signal, yet ADX registers a sell, highlighting notable divergence. RSI leans sell, and supporting indicators such as Stoch RSI, CCI, and Bull/Bear Power show oversold or persistent seller-dominated readings, reinforcing the view of short-term weakness. The Awesome Oscillator remains neutral, providing no clear trend direction.
Rangebound trade expected unless resistance or support decisively breached
Over the next two to three trading days, the expected range for TXN is $288.76 to $314.16, representing the volatility band relative to current levels. There is a 59% probability of an upward move against a 41% chance of a downward break. The baseline forecast anticipates rangebound trading between these key support and resistance levels. Should price move decisively above $303.59 resistance, a bullish scenario would be activated, while a break below $288.76 would signal a bearish move.
Previously it was reported that Texas Instruments was exhibiting strong technical momentum and enhancing its long-term outlook through dividend increases and acquisition-driven growth. The current article signals a shift in near-term dynamics, with short-term technical weakness and oversold conditions emphasizing $303.59 as an immediate resistance level for potential bullish reversal.






Latest Texas Instruments News




-
 Afghanistan
-
 Albania
-
 Algeria
-
 Angola
-
 Argentina
-
 Armenia
-
 Australia
-
 Austria
-
 Azerbaijan
-
 Bahamas
-
 Bahrain
-
 Bangladesh
-
 Belarus
-
 Belgium
-
 Bolivia
-
 Botswana
-
 Brazil
-
 Brunei
-
 Bulgaria
-
 Cambodia
-
 Cameroon
-
 Canada
-
 Chile
-
 China
-
 Colombia
-
 Congo
-
 Costa Rica
-
 Cote d'Ivoire
-
 Croatia
-
 Cuba
-
 Cyprus
-
 Czechia
-
 DR Congo
-
 Denmark
-
 Dominican Republic
-
 Ecuador
-
 Egypt
-
 El Salvador
-
 Estonia
-
 Eswatini
-
 Ethiopia
-
 Finland
-
 France
-
 Georgia
-
 Germany
-
 Ghana
-
 Greece
-
 Haiti
-
 Hong Kong
-
 Hungary
-
 India
-
 Indonesia
-
 Iran, Islamic republic
-
 Iraq
-
 Ireland
-
 Israel
-
 Italy
-
 Jamaica
-
 Japan
-
 Jordan
-
 Kazakhstan
-
 Kenya
-
 Korea
-
 Kuwait
-
 Kyrgyzstan
-
 Laos
-
 Latvia
-
 Lebanon
-
 Lesotho
-
 Libya
-
 Lithuania
-
 Luxembourg
-
 Madagascar
-
 Malaysia
-
 Malta
-
 Mauritius
-
 Mexico
-
 Moldova
-
 Mongolia
-
 Montenegro
-
 Morocco
-
 Mozambique
-
 Myanmar
-
 Namibia
-
 Nepal
-
 Netherlands
-
 New Zealand
-
 Nigeria
-
 North Macedonia
-
 Norway
-
 Oman
-
 Pakistan
-
 Palestine
-
 Panama
-
 Papua New Guinea
-
 Paraguay
-
 Peru
-
 Philippines
-
 Poland
-
 Portugal
-
 Puerto Rico
-
 Qatar
-
 Reunion
-
 Romania
-
 Rwanda
-
 Saudi Arabia
-
 Serbia
-
 Singapore
-
 Slovakia
-
 Slovenia
-
 Somalia
-
 South Africa
-
 Spain
-
 Sri Lanka
-
 Sweden
-
 Switzerland
-
 Syria
-
 Taiwan
-
 Tajikistan
-
 Tanzania
-
 Thailand
-
 Trinidad and Tobago
-
 Tunisia
-
 Turkey
-
 UAE
-
 Uganda
-
 Ukraine
-
 United Kingdom
-
United States
-
 Uruguay
-
 Uzbekistan
-
 Venezuela
-
 Vietnam
-
 Yemen
-
 Zambia
-
 Zimbabwe
- Forex
- Crypto












