

Agnico Eagle Mines stock outlook: Downward momentum persists after latest selloff

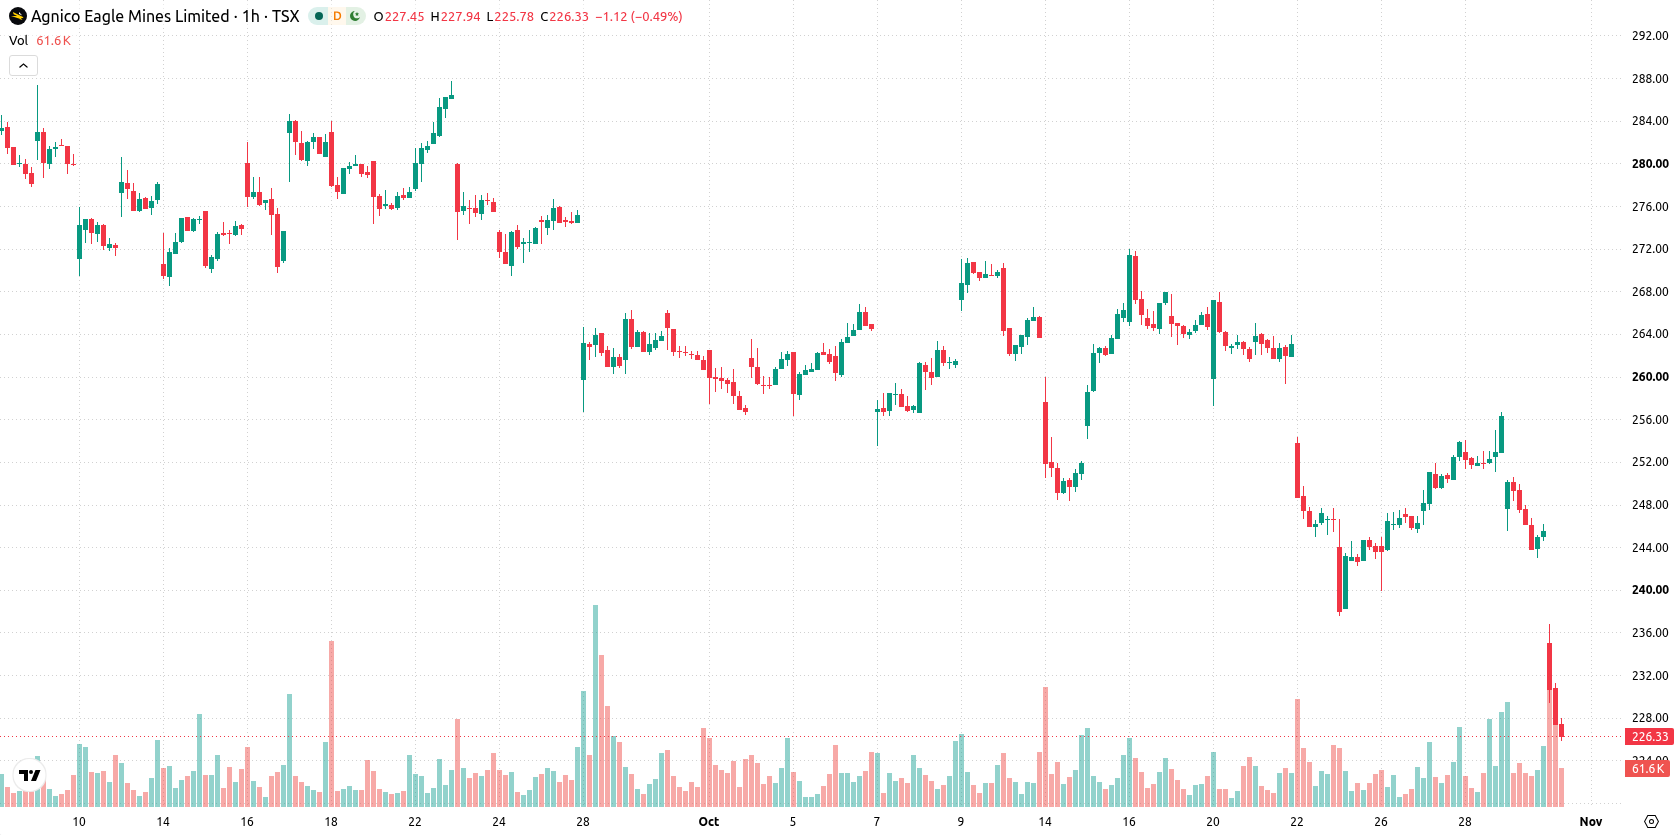
Agnico Eagle Mines (AEM) stock is trading at C$227.23 after slipping 7.49% for the session. The price remains below its key moving averages, reflecting active downward pressure in today’s market.
 235.79
256.51
Highlights
- Agnico Eagle Mines reported third-quarter 2026 gold production of 814,000 ounces and net income of US$1.35 billion.
- Earnings reached $2.62 per share, beating consensus by $0.18, with revenue up 17.1% year over year.
- Shares of Agnico Eagle Mines closed at C$227.23 after dropping 7.49%, with technical signals indicating persistent bearish momentum and a likely range of C$219.85 to C$234.61 in the coming days.
Earnings beat and strong cash flow as shares face market headwinds
Agnico Eagle Mines reported third-quarter 2026 gold production of 814,000 ounces and free cash flow of $852 million, highlighting solid operational execution and reinforcing its funding capacity for growth, according to MarketBeat. Earnings came in at $2.62 per share for the quarter, exceeding consensus by $0.18, while revenue grew 17.1% year over year, reflecting continued demand strength and cost discipline over the period. Net income reached US$1.35 billion and basic EPS from continuing operations reached US$2.67, surpassing both prior-year and consensus benchmarks as noted by Simplywall. As of September 30, 2026, the company’s net cash position of around $3.4 billion, as reported by Tipranks, provides Agnico Eagle Mines with significant financial flexibility for future initiatives, though price action has remained under broader selling pressure.
Resistance clusters and bearish momentum reinforce technical weakness
Technically, AEM/CAD is trading below the MA-20 at C$250.26, MA-50 at C$250.09, and MA-200 at C$263.06. The Ichimoku Kijun stands at C$249.86 and acts as immediate resistance. Indicators reinforce the bearish tone: MACD and ADX are on Sell, RSI is at 40.46 and points to further selling, and Stochastic RSI, CCI, and Bull/Bear Power all show oversold conditions and clear seller dominance. The Awesome Oscillator's direction also supports the current down move.
Downside risk elevated as volatility bands define trading outlook
For the short term, AEM/CAD is expected to remain within a volatility band of C$219.85 to C$234.61, based on current technicals and momentum signals. The probability of a downward move is estimated at 77%, while an upside move faces a lower probability of 23%. An upward scenario would require a break above the immediate resistance level, while a failure to hold above support may accelerate the decline. The baseline expectation is continued consolidation within this range over the next several days.
Earlier, analysts noted that Agnico Eagle Mines faced sustained technical pressure and downside risk despite robust financial results. The current analysis reinforces this negative momentum, with traders advised to monitor the C$219.85 support as a potential inflection point for further downside movement.










-
 Afghanistan
-
 Albania
-
 Algeria
-
 Angola
-
 Argentina
-
 Armenia
-
 Australia
-
 Austria
-
 Azerbaijan
-
 Bahamas
-
 Bahrain
-
 Bangladesh
-
 Belarus
-
 Belgium
-
 Bolivia
-
 Botswana
-
 Brazil
-
 Brunei
-
 Bulgaria
-
 Cambodia
-
 Cameroon
-
 Canada
-
 Chile
-
 China
-
 Colombia
-
 Congo
-
 Costa Rica
-
 Cote d'Ivoire
-
 Croatia
-
 Cuba
-
 Cyprus
-
 Czechia
-
 DR Congo
-
 Denmark
-
 Dominican Republic
-
 Ecuador
-
 Egypt
-
 El Salvador
-
 Estonia
-
 Eswatini
-
 Ethiopia
-
 Finland
-
 France
-
 Georgia
-
 Germany
-
 Ghana
-
 Greece
-
 Haiti
-
 Hong Kong
-
 Hungary
-
 India
-
 Indonesia
-
 Iran, Islamic republic
-
 Iraq
-
 Ireland
-
 Israel
-
 Italy
-
 Jamaica
-
 Japan
-
 Jordan
-
 Kazakhstan
-
 Kenya
-
 Korea
-
 Kuwait
-
 Kyrgyzstan
-
 Laos
-
 Latvia
-
 Lebanon
-
 Lesotho
-
 Libya
-
 Lithuania
-
 Luxembourg
-
 Madagascar
-
 Malaysia
-
 Malta
-
 Mauritius
-
 Mexico
-
 Moldova
-
 Mongolia
-
 Montenegro
-
 Morocco
-
 Mozambique
-
 Myanmar
-
 Namibia
-
 Nepal
-
 Netherlands
-
 New Zealand
-
 Nigeria
-
 North Macedonia
-
 Norway
-
 Oman
-
 Pakistan
-
 Palestine
-
 Panama
-
 Papua New Guinea
-
 Paraguay
-
 Peru
-
 Philippines
-
 Poland
-
 Portugal
-
 Puerto Rico
-
 Qatar
-
 Reunion
-
 Romania
-
 Rwanda
-
 Saudi Arabia
-
 Serbia
-
 Singapore
-
 Slovakia
-
 Slovenia
-
 Somalia
-
 South Africa
-
 Spain
-
 Sri Lanka
-
 Sweden
-
 Switzerland
-
 Syria
-
 Taiwan
-
 Tajikistan
-
 Tanzania
-
 Thailand
-
 Trinidad and Tobago
-
 Tunisia
-
 Turkey
-
 UAE
-
 Uganda
-
 Ukraine
-
 United Kingdom
-
United States
-
 Uruguay
-
 Uzbekistan
-
 Venezuela
-
 Vietnam
-
 Yemen
-
 Zambia
-
 Zimbabwe
- Forex
- Crypto












