

Riot Platforms stock price prediction: Bearish momentum persists with key support in focus

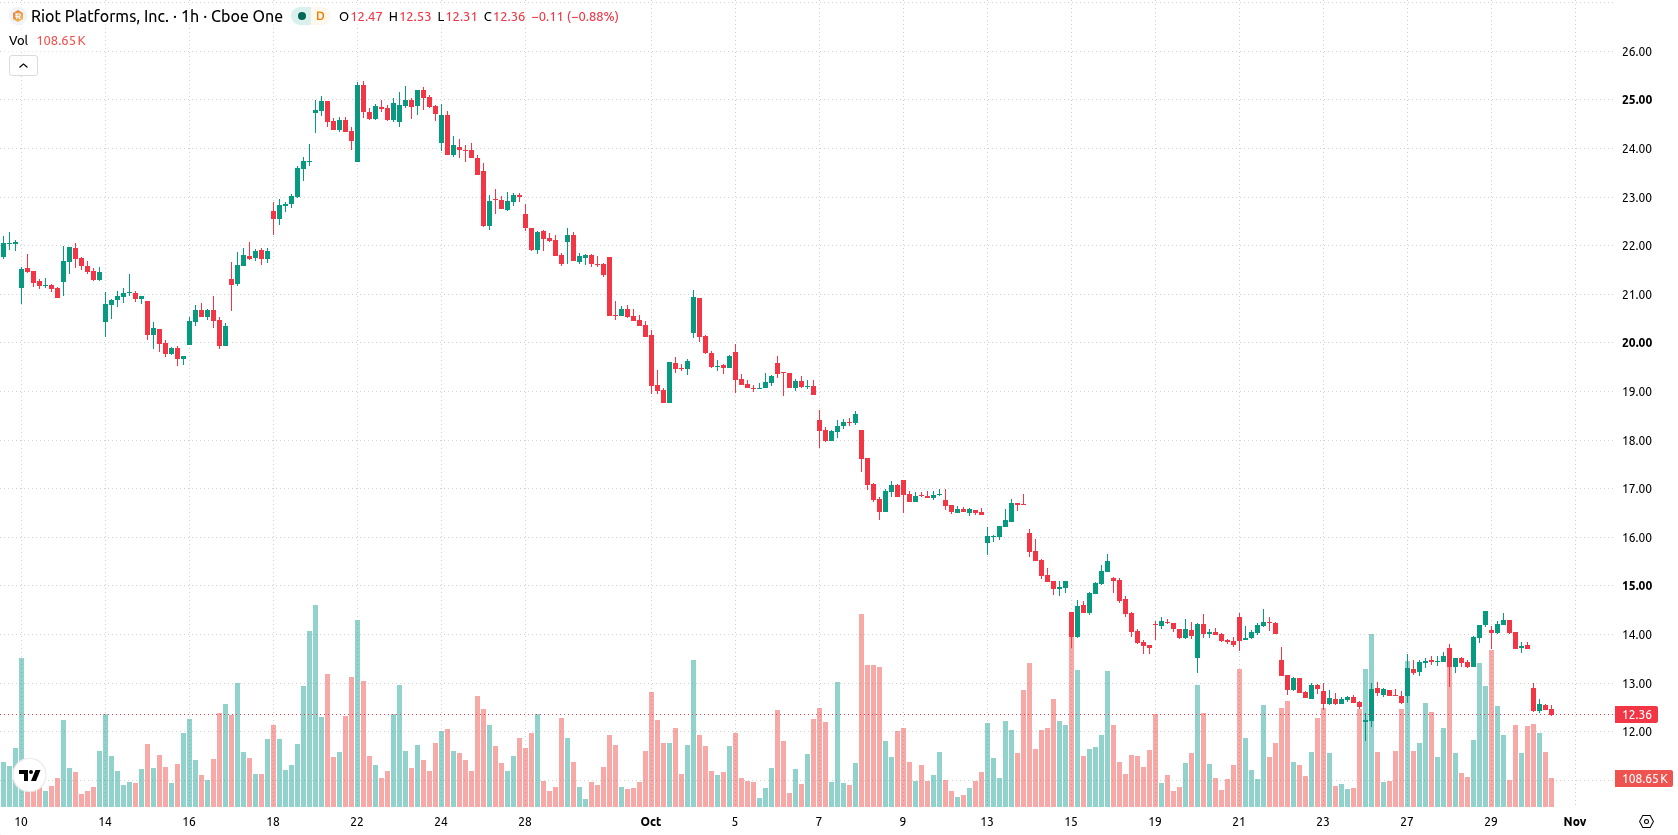
Riot Platforms (RIOT) stock is trading at $12.48 after a daily decline of 9.2%. The price currently sits below its key moving averages, highlighting pressure from sellers across multiple timeframes.
 14.05
14.44
Highlights
- RIOT/USD trades below key moving averages with sellers pressuring the price in short-, medium-, and long-term timeframes.
- Momentum indicators give mixed signals, with a strong buy from MACD, neutral ADX, and oversold Stoch RSI.
- RIOT/USD closed at $12.48, down 9.2% today, with forecasted range $11.29 to $13.92 and a 79% probability of moving lower.
Mixed momentum and resistance cap further upside risk
On the hourly chart, RIOT is trading below the MA-20 at $13.73 and the MA-50 at $13.36, with the long-term MA-200 at $19.43 confirming extended downside pressure. The Ichimoku Kijun at $13.53 is acting as immediate resistance. Momentum indicators are mixed: MACD is showing a strong buy signal, ADX is neutral, and the RSI is near 52, giving a buy signal. However, Stoch RSI appears oversold and CCI is neutral, pointing to disagreement among oscillators. Bull/Bear Power signals seller dominance with a sell reading, while the Awesome Oscillator remains neutral.
Bearish bias likely as downside probability outweighs upside
RIOT is expected to trade between $11.29 and $13.92 in the coming days, with a 21% probability of an upward move and a 79% chance of further decline. The baseline scenario anticipates a continued sideways corridor. If the price breaks above immediate resistance at $13.53, a bullish move could follow; however, if support fails, RIOT may test the lower end of the volatility band.
Earlier, analysts noted that Riot Platforms faced mixed technical signals amid downside risks, while potential business diversification and earnings developments offered some support against volatility. The latest data underscores persistent selling pressure and highlights $13.53 as a pivotal resistance level to monitor for signs of any short-term reversal.









-
 Afghanistan
-
 Albania
-
 Algeria
-
 Angola
-
 Argentina
-
 Armenia
-
 Australia
-
 Austria
-
 Azerbaijan
-
 Bahamas
-
 Bahrain
-
 Bangladesh
-
 Belarus
-
 Belgium
-
 Bolivia
-
 Botswana
-
 Brazil
-
 Brunei
-
 Bulgaria
-
 Cambodia
-
 Cameroon
-
 Canada
-
 Chile
-
 China
-
 Colombia
-
 Congo
-
 Costa Rica
-
 Cote d'Ivoire
-
 Croatia
-
 Cuba
-
 Cyprus
-
 Czechia
-
 DR Congo
-
 Denmark
-
 Dominican Republic
-
 Ecuador
-
 Egypt
-
 El Salvador
-
 Estonia
-
 Eswatini
-
 Ethiopia
-
 Finland
-
 France
-
 Georgia
-
 Germany
-
 Ghana
-
 Greece
-
 Haiti
-
 Hong Kong
-
 Hungary
-
 India
-
 Indonesia
-
 Iran, Islamic republic
-
 Iraq
-
 Ireland
-
 Israel
-
 Italy
-
 Jamaica
-
 Japan
-
 Jordan
-
 Kazakhstan
-
 Kenya
-
 Korea
-
 Kuwait
-
 Kyrgyzstan
-
 Laos
-
 Latvia
-
 Lebanon
-
 Lesotho
-
 Libya
-
 Lithuania
-
 Luxembourg
-
 Madagascar
-
 Malaysia
-
 Malta
-
 Mauritius
-
 Mexico
-
 Moldova
-
 Mongolia
-
 Montenegro
-
 Morocco
-
 Mozambique
-
 Myanmar
-
 Namibia
-
 Nepal
-
 Netherlands
-
 New Zealand
-
 Nigeria
-
 North Macedonia
-
 Norway
-
 Oman
-
 Pakistan
-
 Palestine
-
 Panama
-
 Papua New Guinea
-
 Paraguay
-
 Peru
-
 Philippines
-
 Poland
-
 Portugal
-
 Puerto Rico
-
 Qatar
-
 Reunion
-
 Romania
-
 Rwanda
-
 Saudi Arabia
-
 Serbia
-
 Singapore
-
 Slovakia
-
 Slovenia
-
 Somalia
-
 South Africa
-
 Spain
-
 Sri Lanka
-
 Sweden
-
 Switzerland
-
 Syria
-
 Taiwan
-
 Tajikistan
-
 Tanzania
-
 Thailand
-
 Trinidad and Tobago
-
 Tunisia
-
 Turkey
-
 UAE
-
 Uganda
-
 Ukraine
-
 United Kingdom
-
United States
-
 Uruguay
-
 Uzbekistan
-
 Venezuela
-
 Vietnam
-
 Yemen
-
 Zambia
-
 Zimbabwe
- Forex
- Crypto












