


CF Industries Holdings (CF) advanced 3.42% on a surge of technical momentum, with buyers dominating intraday and the stock pushing toward the high end of its daily range. This move looks limited by medium-term resistance near the 50-day moving average, even as long- and short-term trend alignment provides underlying support.
 121.50
123.50
Highlights
- CF Industries stock trades above short- and long-term moving averages, but remains below medium-term resistance, indicating a bullish trend with near-term pause.
- Momentum signals conflict as MACD shows sell pressure while intraday indicators and price action confirm session strength and buyer control.
- Shares face resistance at $123.06 and support at $121.5, with an expected five-day range of $118.86 to $126.08 and a 74% probability of a downward move.
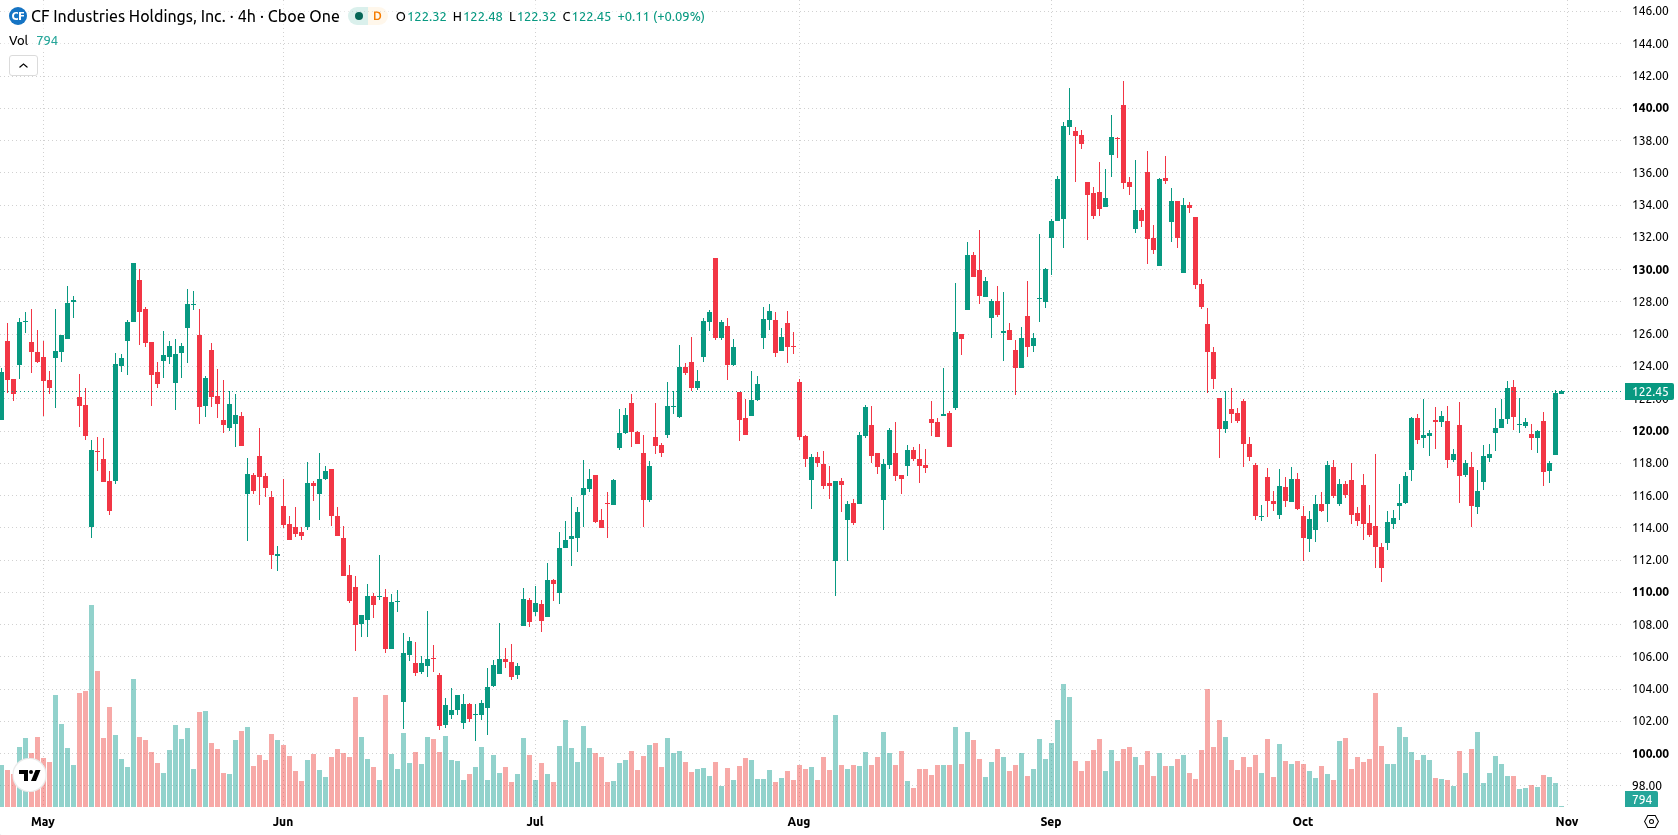
Mixed momentum readings as price holds above support but lags 50-day
CF Industries is trading above its 20-day and 200-day moving averages ($117.51 and $116.16), but remains below the 50-day moving average ($123.49). This set-up reflects solid short- and long-term support with medium-term resistance overhead, signaling a bullish trend context. Nearest resistance is at $123.06 and the closest support is at $121.5. Momentum signals are mixed: the MACD is negative with a 'Strong Sell' outlook, indicating near-term selling pressure, while the ADX is neutral and not trending strongly. The RSI stands neutral at 46.66, joined by neutral Stochastic RSI readings, so there are no strong overbought or oversold conditions. Bull/Bear Power intraday shows buyers dominating, but registers an 'Overbought' alert. The Awesome Oscillator gives a 'Strong Buy' reading, supporting a bullish intraday stance. CF has gained $4.04 (3.42%) on the day, starting with an upside gap of $0.46 (0.39%) and trading near its daily high, with intraday volatility at 2.62%. Strength toward session highs is evident even as underlying indicators show a divergent, mixed momentum profile.
Earlier, analysts noted that CF Industries was experiencing persistent short-term selling pressure within an overall bullish long-term technical structure. The current rebound introduces a notable shift, with attention now centered on a potential breakout above $123.06 as the next critical level to watch.






Latest CF Industries Holdings News




-
 Afghanistan
-
 Albania
-
 Algeria
-
 Angola
-
 Argentina
-
 Armenia
-
 Australia
-
 Austria
-
 Azerbaijan
-
 Bahamas
-
 Bahrain
-
 Bangladesh
-
 Belarus
-
 Belgium
-
 Bolivia
-
 Botswana
-
 Brazil
-
 Brunei
-
 Bulgaria
-
 Cambodia
-
 Cameroon
-
 Canada
-
 Chile
-
 China
-
 Colombia
-
 Congo
-
 Costa Rica
-
 Cote d'Ivoire
-
 Croatia
-
 Cuba
-
 Cyprus
-
 Czechia
-
 DR Congo
-
 Denmark
-
 Dominican Republic
-
 Ecuador
-
 Egypt
-
 El Salvador
-
 Estonia
-
 Eswatini
-
 Ethiopia
-
 Finland
-
 France
-
 Georgia
-
 Germany
-
 Ghana
-
 Greece
-
 Haiti
-
 Hong Kong
-
 Hungary
-
 India
-
 Indonesia
-
 Iran, Islamic republic
-
 Iraq
-
 Ireland
-
 Israel
-
 Italy
-
 Jamaica
-
 Japan
-
 Jordan
-
 Kazakhstan
-
 Kenya
-
 Korea
-
 Kuwait
-
 Kyrgyzstan
-
 Laos
-
 Latvia
-
 Lebanon
-
 Lesotho
-
 Libya
-
 Lithuania
-
 Luxembourg
-
 Madagascar
-
 Malaysia
-
 Malta
-
 Mauritius
-
 Mexico
-
 Moldova
-
 Mongolia
-
 Montenegro
-
 Morocco
-
 Mozambique
-
 Myanmar
-
 Namibia
-
 Nepal
-
 Netherlands
-
 New Zealand
-
 Nigeria
-
 North Macedonia
-
 Norway
-
 Oman
-
 Pakistan
-
 Palestine
-
 Panama
-
 Papua New Guinea
-
 Paraguay
-
 Peru
-
 Philippines
-
 Poland
-
 Portugal
-
 Puerto Rico
-
 Qatar
-
 Reunion
-
 Romania
-
 Rwanda
-
 Saudi Arabia
-
 Serbia
-
 Singapore
-
 Slovakia
-
 Slovenia
-
 Somalia
-
 South Africa
-
 Spain
-
 Sri Lanka
-
 Sweden
-
 Switzerland
-
 Syria
-
 Taiwan
-
 Tajikistan
-
 Tanzania
-
 Thailand
-
 Trinidad and Tobago
-
 Tunisia
-
 Turkey
-
 UAE
-
 Uganda
-
 Ukraine
-
 United Kingdom
-
United States
-
 Uruguay
-
 Uzbekistan
-
 Venezuela
-
 Vietnam
-
 Yemen
-
 Zambia
-
 Zimbabwe
- Forex
- Crypto












