

ServiceNow shares technical analysis: Persistent seller pressure highlights downside risk

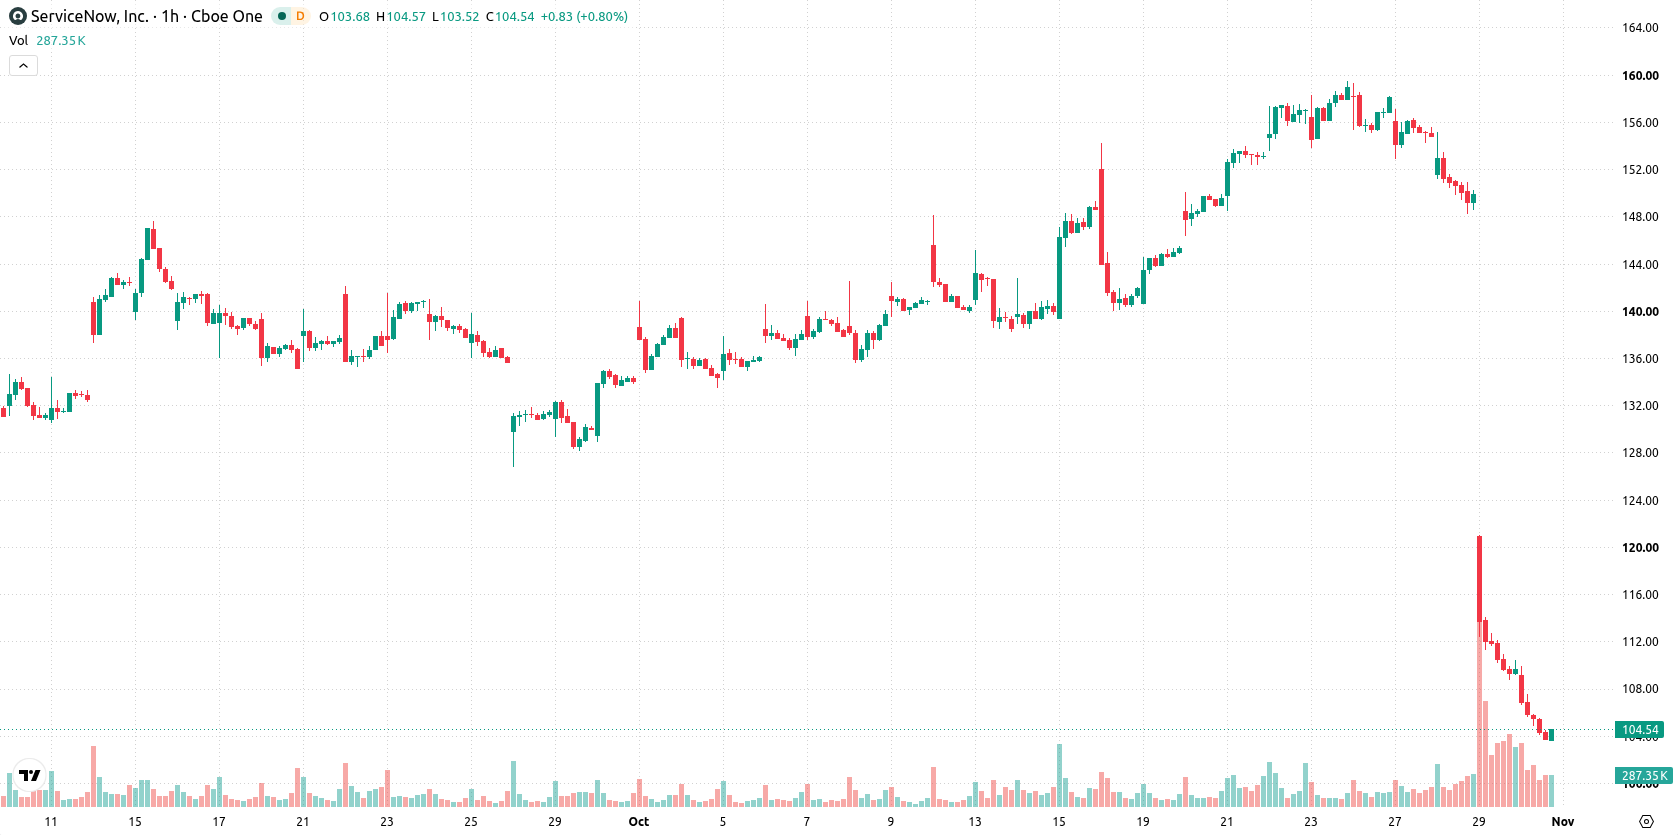
ServiceNow (NOW) stock is trading at $104.39 after a decline of 4.8% today. The price remains below its main moving averages, highlighting ongoing pressure from sellers.
 109.90
158.90
Highlights
- ServiceNow posted third-quarter 2026 revenue of $4.11 billion, up 20.5% year over year, but adjusted earnings per share of $1.00 missed consensus.
- Forward guidance projects current remaining performance obligations growth of 18.5% in the fourth quarter and raises the 2026 AI product contract value target to $1.7 billion.
- Shares of ServiceNow trade at $104.39, below key moving averages with momentum signals strongly negative; the price is expected to range $83.51 to $125.27 with a 79% likelihood of further declines.
Mixed outlook as revenue beats but earnings lag and guidance dims
ServiceNow reported third-quarter 2026 revenue of $4.11 billion, up 20.5% year over year, with adjusted earnings per share of $1.00 falling short of consensus and forward guidance indicating a slowdown in current remaining performance obligations growth to 18.5% in the fourth quarter, according to CNBC. This combination of strong sales growth but weaker profit delivery and softer forward outlook weighed on sentiment and drove heightened caution among investors. The company also lifted its annual contract value target for 2026 AI products to $1.7 billion, reflecting higher-than-anticipated enterprise adoption, as noted by Fool, and broadened its AI partnership strategy through an expanded collaboration with OpenAI and new AI governance initiatives, according to Forkast.
Firm downside momentum as key averages breached and oversold signals deepen
Technical analysis on the current timeframe shows NOW is trading below its MA-20 at $135.63, MA-50 at $147.76, and MA-200 at $115.13. The Ichimoku Kijun level stands at $131.04, acting as immediate resistance. Momentum indicators remain clearly negative: RSI is exceptionally low at 7.38, while Stochastic RSI, CCI, and Bull/Bear Power all register oversold levels. Both MACD and ADX reinforce a strong sell bias, and the Awesome Oscillator has shifted to neutral without offsetting the prevailing trend.
Downside risks elevated as volatility range and selling pressure persist
In the short term, the price is likely to trade within a broad range between $83.51 and $125.27, capturing the typical volatility band relative to current levels. The probability of a downward extension stands at 79%, signaling an elevated chance of continued weakness if sellers maintain control. Should the price find support at the lower end of the forecast range, a volatile consolidation phase could unfold; conversely, an upward scenario would require a break above immediate resistance to shift momentum in favor of buyers.
Previously it was reported that ServiceNow faced persistent downside risk and ongoing technical weakness following a rare earnings miss and challenging market conditions. The current analysis reinforces this negative trend, with new evidence of lower profit delivery and clearly oversold technicals suggesting traders should closely monitor the $83.51 to $125.27 range for potential volatility and support tests.






Latest ServiceNow News



-
 Afghanistan
-
 Albania
-
 Algeria
-
 Angola
-
 Argentina
-
 Armenia
-
 Australia
-
 Austria
-
 Azerbaijan
-
 Bahamas
-
 Bahrain
-
 Bangladesh
-
 Belarus
-
 Belgium
-
 Bolivia
-
 Botswana
-
 Brazil
-
 Brunei
-
 Bulgaria
-
 Cambodia
-
 Cameroon
-
 Canada
-
 Chile
-
 China
-
 Colombia
-
 Congo
-
 Costa Rica
-
 Cote d'Ivoire
-
 Croatia
-
 Cuba
-
 Cyprus
-
 Czechia
-
 DR Congo
-
 Denmark
-
 Dominican Republic
-
 Ecuador
-
 Egypt
-
 El Salvador
-
 Estonia
-
 Eswatini
-
 Ethiopia
-
 Finland
-
 France
-
 Georgia
-
 Germany
-
 Ghana
-
 Greece
-
 Haiti
-
 Hong Kong
-
 Hungary
-
 India
-
 Indonesia
-
 Iran, Islamic republic
-
 Iraq
-
 Ireland
-
 Israel
-
 Italy
-
 Jamaica
-
 Japan
-
 Jordan
-
 Kazakhstan
-
 Kenya
-
 Korea
-
 Kuwait
-
 Kyrgyzstan
-
 Laos
-
 Latvia
-
 Lebanon
-
 Lesotho
-
 Libya
-
 Lithuania
-
 Luxembourg
-
 Madagascar
-
 Malaysia
-
 Malta
-
 Mauritius
-
 Mexico
-
 Moldova
-
 Mongolia
-
 Montenegro
-
 Morocco
-
 Mozambique
-
 Myanmar
-
 Namibia
-
 Nepal
-
 Netherlands
-
 New Zealand
-
 Nigeria
-
 North Macedonia
-
 Norway
-
 Oman
-
 Pakistan
-
 Palestine
-
 Panama
-
 Papua New Guinea
-
 Paraguay
-
 Peru
-
 Philippines
-
 Poland
-
 Portugal
-
 Puerto Rico
-
 Qatar
-
 Reunion
-
 Romania
-
 Rwanda
-
 Saudi Arabia
-
 Serbia
-
 Singapore
-
 Slovakia
-
 Slovenia
-
 Somalia
-
 South Africa
-
 Spain
-
 Sri Lanka
-
 Sweden
-
 Switzerland
-
 Syria
-
 Taiwan
-
 Tajikistan
-
 Tanzania
-
 Thailand
-
 Trinidad and Tobago
-
 Tunisia
-
 Turkey
-
 UAE
-
 Uganda
-
 Ukraine
-
 United Kingdom
-
United States
-
 Uruguay
-
 Uzbekistan
-
 Venezuela
-
 Vietnam
-
 Yemen
-
 Zambia
-
 Zimbabwe
- Forex
- Crypto












