

Will Mastercard stock break $672.09 resistance amid strong earnings and bullish momentum?

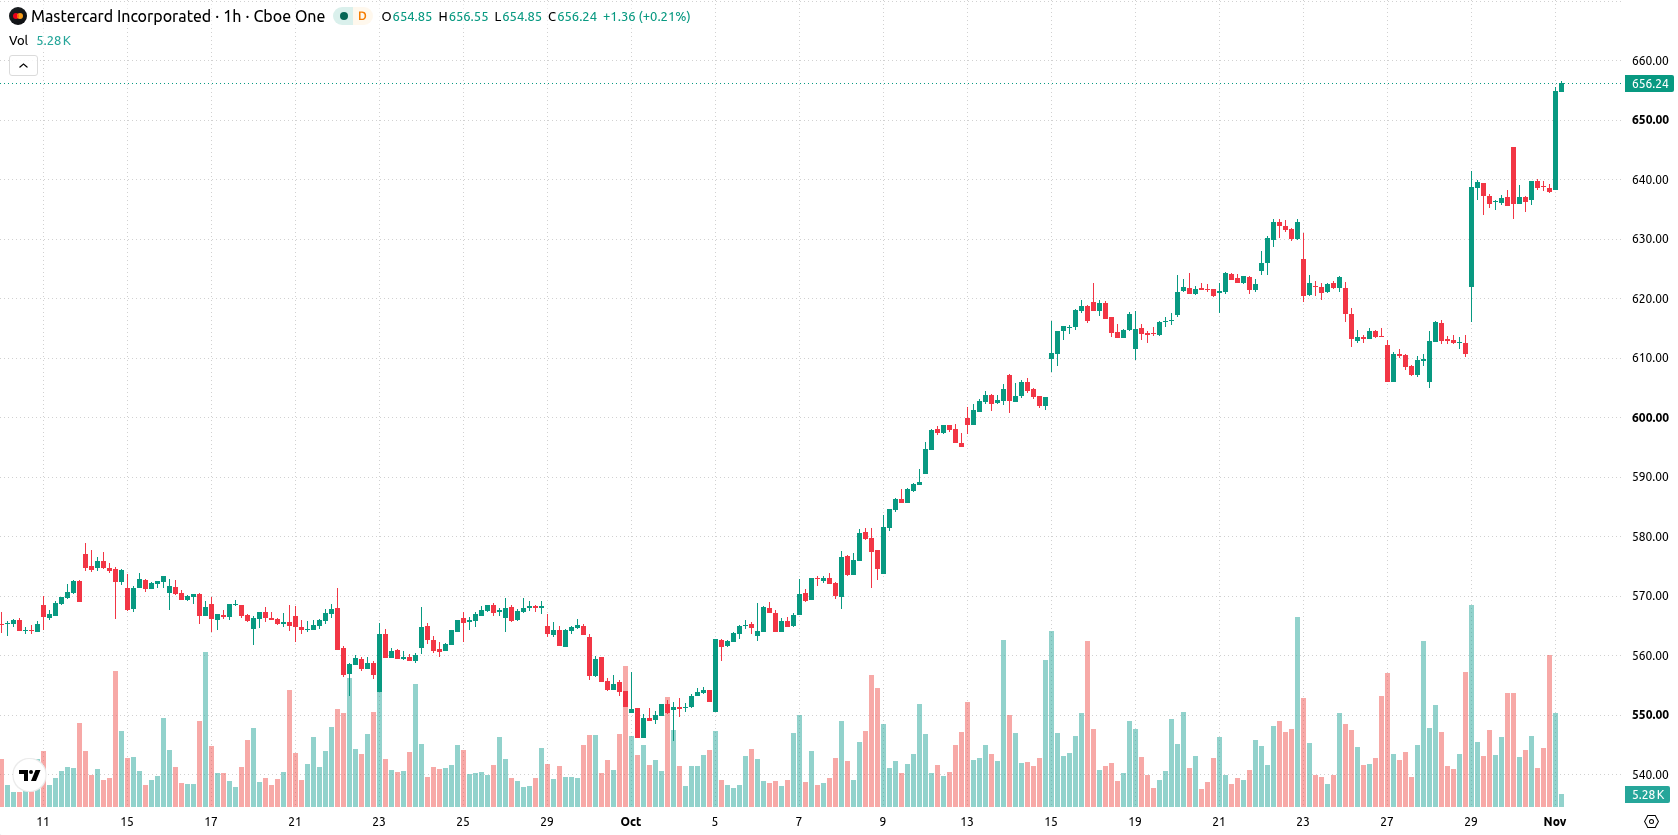
Mastercard (MA) stock is trading at $656.85 after climbing 2.96% on the day. The stock is positioned above its key short- and medium-term moving averages, as well as well above its longer-term daily average.
 661.34
Highlights
- Mastercard stock rose after net revenue climbed 14% to $9.8 billion and net income increased 18% to $4.6 billion in Q3 2026.
- Earnings per share surpassed expectations at $5.31, and a $9 billion share buyback raised per-share value and supported the stock price.
- Shares advanced 2.96% to $656.85 with strong bullish momentum, short-term overbought signals, and a projected trading range of $636.66 to $672.09.
Earnings beat and buyback drive stock amid institutional demand
Mastercard reported a 14% increase in net revenue to $9.8 billion for the third quarter of 2026, with net income rising 18% to approximately $4.6 billion and earnings per share surpassing market expectations, according to Themarketsdaily. This strong earnings performance — including adjusted EPS of $5.31 — highlights robust demand across Mastercard’s payment network and strengthens the company’s growth narrative, fueling institutional buying interest. In addition, completion of a $9.0 billion share buyback during the quarter has increased per-share value and provided direct support to the stock price in the current session.
Overbought signals as price outpaces support and momentum diverges
On the hourly chart, MA is trading above the MA-20 at $631.92 and the MA-50 at $623.97, with the daily MA-200 far below at $535.74. The immediate Ichimoku Kijun support level sits at $628.25, anchoring near-term downside risk. Momentum signals are largely bullish — MACD and ADX both indicate Buy — while RSI, Stoch RSI, CCI, and Bull/Bear Power reflect overbought conditions with buyers dominating intraday. The Awesome Oscillator is neutral and does not confirm the prevailing uptrend, highlighting a possible divergence and hinting at near-term exhaustion.
Bullish bias as consolidation precedes potential breakout
In the short term, MA is projected to consolidate within a range of $636.66 to $672.09, defining a typical volatility band relative to current levels. Upward price movement has a very high probability, with bullish scenarios favoring a breakout above the range toward a fresh leg higher if resistance gives way. Alternatively, if the Kijun or range low fails to hold, a deeper pullback may develop, though the likelihood of a significant downward move remains low.
Earlier, analysts noted that Mastercard's broad-based consumer spending resilience and strong quarterly earnings performance helped buffer the stock against macroeconomic uncertainty. This current analysis adds tactical insight, highlighting that while near-term momentum indicators are bullish, traders should monitor the $628 support level and $672 resistance for signs of a sustained breakout or possible range-bound consolidation.











-
 Afghanistan
-
 Albania
-
 Algeria
-
 Angola
-
 Argentina
-
 Armenia
-
 Australia
-
 Austria
-
 Azerbaijan
-
 Bahamas
-
 Bahrain
-
 Bangladesh
-
 Belarus
-
 Belgium
-
 Bolivia
-
 Botswana
-
 Brazil
-
 Brunei
-
 Bulgaria
-
 Cambodia
-
 Cameroon
-
 Canada
-
 Chile
-
 China
-
 Colombia
-
 Congo
-
 Costa Rica
-
 Cote d'Ivoire
-
 Croatia
-
 Cuba
-
 Cyprus
-
 Czechia
-
 DR Congo
-
 Denmark
-
 Dominican Republic
-
 Ecuador
-
 Egypt
-
 El Salvador
-
 Estonia
-
 Eswatini
-
 Ethiopia
-
 Finland
-
 France
-
 Georgia
-
 Germany
-
 Ghana
-
 Greece
-
 Haiti
-
 Hong Kong
-
 Hungary
-
 India
-
 Indonesia
-
 Iran, Islamic republic
-
 Iraq
-
 Ireland
-
 Israel
-
 Italy
-
 Jamaica
-
 Japan
-
 Jordan
-
 Kazakhstan
-
 Kenya
-
 Korea
-
 Kuwait
-
 Kyrgyzstan
-
 Laos
-
 Latvia
-
 Lebanon
-
 Lesotho
-
 Libya
-
 Lithuania
-
 Luxembourg
-
 Madagascar
-
 Malaysia
-
 Malta
-
 Mauritius
-
 Mexico
-
 Moldova
-
 Mongolia
-
 Montenegro
-
 Morocco
-
 Mozambique
-
 Myanmar
-
 Namibia
-
 Nepal
-
 Netherlands
-
 New Zealand
-
 Nigeria
-
 North Macedonia
-
 Norway
-
 Oman
-
 Pakistan
-
 Palestine
-
 Panama
-
 Papua New Guinea
-
 Paraguay
-
 Peru
-
 Philippines
-
 Poland
-
 Portugal
-
 Puerto Rico
-
 Qatar
-
 Reunion
-
 Romania
-
 Rwanda
-
 Saudi Arabia
-
 Serbia
-
 Singapore
-
 Slovakia
-
 Slovenia
-
 Somalia
-
 South Africa
-
 Spain
-
 Sri Lanka
-
 Sweden
-
 Switzerland
-
 Syria
-
 Taiwan
-
 Tajikistan
-
 Tanzania
-
 Thailand
-
 Trinidad and Tobago
-
 Tunisia
-
 Turkey
-
 UAE
-
 Uganda
-
 Ukraine
-
 United Kingdom
-
United States
-
 Uruguay
-
 Uzbekistan
-
 Venezuela
-
 Vietnam
-
 Yemen
-
 Zambia
-
 Zimbabwe
- Forex
- Crypto












