

Microsoft stock consolidates near $526.88 resistance while weak momentum limits upside

Microsoft (MSFT) stock is trading at $525.74 after a modest session gain. The price currently sits above its key moving averages but remains near the upper end of the recent range.
 529.63
534.70
Highlights
- Microsoft reported fiscal Q1 2027 revenue of $92.3 billion, increasing 19% year over year and exceeding analyst expectations.
- Non-GAAP earnings per share grew 18% to $4.89 for the quarter ended September 30, 2026.
- Microsoft stock faces short-term buying interest with resistance near $527.66 and is forecast to trade between $518.44 and $533.04 as technical signals are mixed.
Earnings beat spurs bullish sentiment amid robust revenue growth
Microsoft reported its fiscal Q1 2027 earnings for the quarter ended September 30, 2026, with revenue growing 19% year over year to $92.3 billion and non-GAAP earnings per share climbing 18% to $4.89, exceeding analyst expectations, according to Aol. This outperformance signals robust operational momentum driven by greater demand across Microsoft’s product lines. The stronger-than-expected results are likely fostering improved institutional and retail sentiment as investors digest the latest reported quarter’s figures.
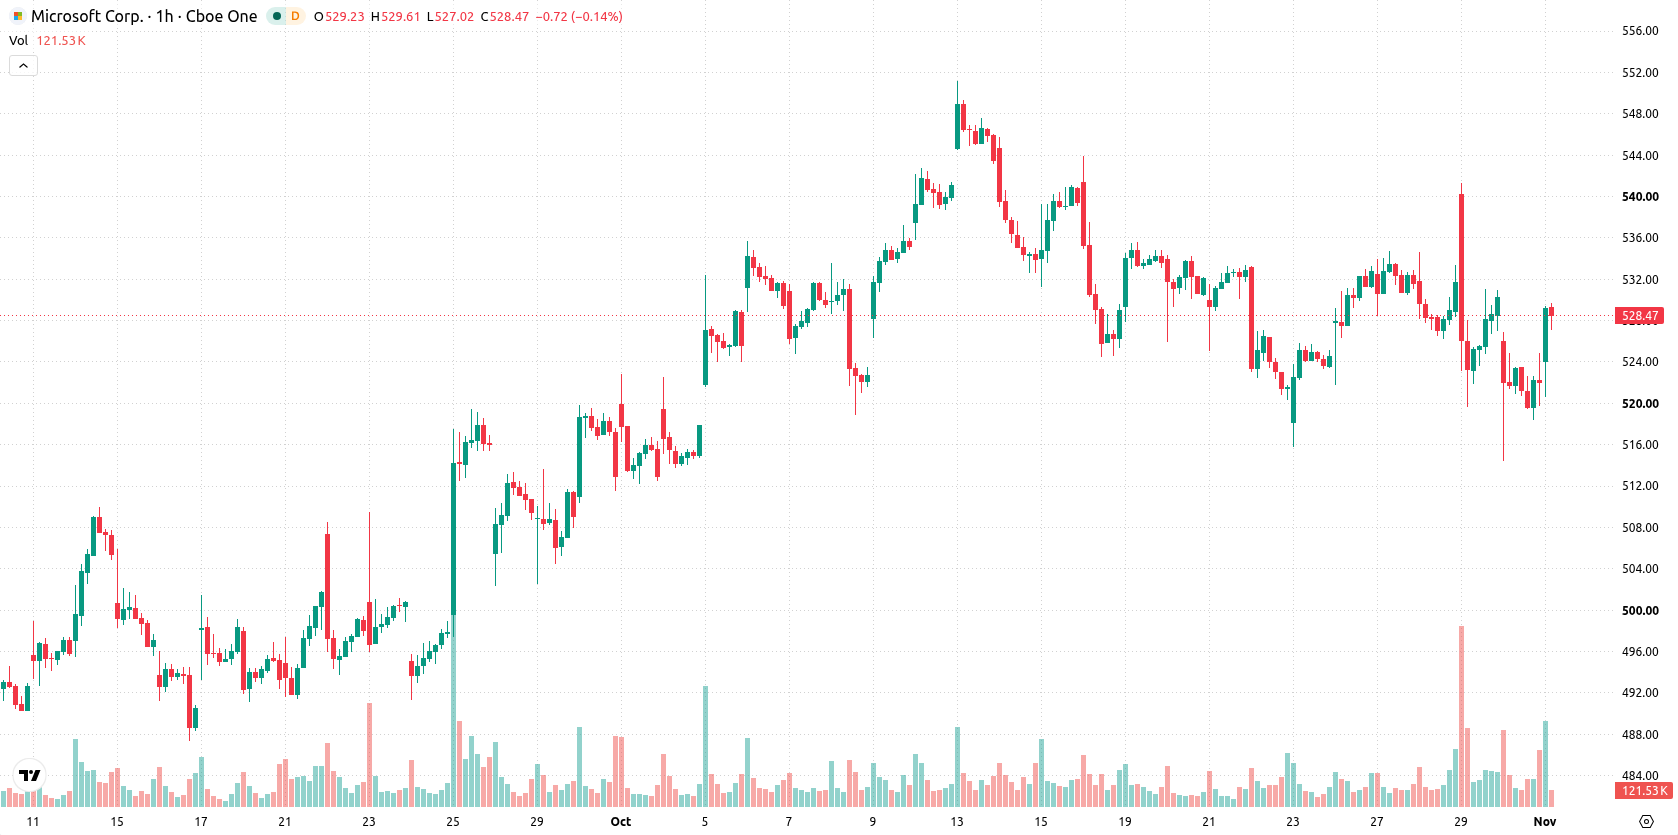
Mixed momentum as resistance and support levels converge
On the technical front, MSFT faces resistance at the MA-50 ($526.88) and the Ichimoku Kijun level at $527.66, while support is defined by the MA-20 at $525.35 and the lower boundary near $518.44. MSFT remains well above the long-term MA-200 ($437.89), indicating longer-term stability. Momentum signals are mixed: MACD points to a Sell, ADX suggests a Buy, and RSI at 48.1 also leans bearish. Both Stochastic RSI and CCI are Neutral, while Bull/Bear Power indicates an intraday overbought, buyer-dominated environment, pointing to a potential for short-term volatility.
Downside risk elevated as rangebound trading persists
Over the next few days, MSFT is expected to trade within a range of $518.44 to $533.04, representing a typical volatility band relative to current levels. The forecast probability suggests a 55% chance of a downward move versus 45% for an upward breakout, pointing to a slightly higher risk of decline. If prices break above $527.66, further upward momentum is possible; alternatively, a move below $518.44 may trigger renewed selling pressure and downside extension.
In a recent review, analysts noted that Microsoft's long-term outlook is increasingly reliant on the strength of its cloud and AI-driven businesses, while traditional segments lag behind. The latest earnings surprise reinforces this shift and, with technical signals mixed, traders should watch for a decisive move above $527.66 or below $518.44 to confirm the next trend direction.






Latest Microsoft News





-
 Afghanistan
-
 Albania
-
 Algeria
-
 Angola
-
 Argentina
-
 Armenia
-
 Australia
-
 Austria
-
 Azerbaijan
-
 Bahamas
-
 Bahrain
-
 Bangladesh
-
 Belarus
-
 Belgium
-
 Bolivia
-
 Botswana
-
 Brazil
-
 Brunei
-
 Bulgaria
-
 Cambodia
-
 Cameroon
-
 Canada
-
 Chile
-
 China
-
 Colombia
-
 Congo
-
 Costa Rica
-
 Cote d'Ivoire
-
 Croatia
-
 Cuba
-
 Cyprus
-
 Czechia
-
 DR Congo
-
 Denmark
-
 Dominican Republic
-
 Ecuador
-
 Egypt
-
 El Salvador
-
 Estonia
-
 Eswatini
-
 Ethiopia
-
 Finland
-
 France
-
 Georgia
-
 Germany
-
 Ghana
-
 Greece
-
 Haiti
-
 Hong Kong
-
 Hungary
-
 India
-
 Indonesia
-
 Iran, Islamic republic
-
 Iraq
-
 Ireland
-
 Israel
-
 Italy
-
 Jamaica
-
 Japan
-
 Jordan
-
 Kazakhstan
-
 Kenya
-
 Korea
-
 Kuwait
-
 Kyrgyzstan
-
 Laos
-
 Latvia
-
 Lebanon
-
 Lesotho
-
 Libya
-
 Lithuania
-
 Luxembourg
-
 Madagascar
-
 Malaysia
-
 Malta
-
 Mauritius
-
 Mexico
-
 Moldova
-
 Mongolia
-
 Montenegro
-
 Morocco
-
 Mozambique
-
 Myanmar
-
 Namibia
-
 Nepal
-
 Netherlands
-
 New Zealand
-
 Nigeria
-
 North Macedonia
-
 Norway
-
 Oman
-
 Pakistan
-
 Palestine
-
 Panama
-
 Papua New Guinea
-
 Paraguay
-
 Peru
-
 Philippines
-
 Poland
-
 Portugal
-
 Puerto Rico
-
 Qatar
-
 Reunion
-
 Romania
-
 Rwanda
-
 Saudi Arabia
-
 Serbia
-
 Singapore
-
 Slovakia
-
 Slovenia
-
 Somalia
-
 South Africa
-
 Spain
-
 Sri Lanka
-
 Sweden
-
 Switzerland
-
 Syria
-
 Taiwan
-
 Tajikistan
-
 Tanzania
-
 Thailand
-
 Trinidad and Tobago
-
 Tunisia
-
 Turkey
-
 UAE
-
 Uganda
-
 Ukraine
-
 United Kingdom
-
United States
-
 Uruguay
-
 Uzbekistan
-
 Venezuela
-
 Vietnam
-
 Yemen
-
 Zambia
-
 Zimbabwe
- Forex
- Crypto












