

Will Alphabet stock overcome fading momentum amid seller dominance?

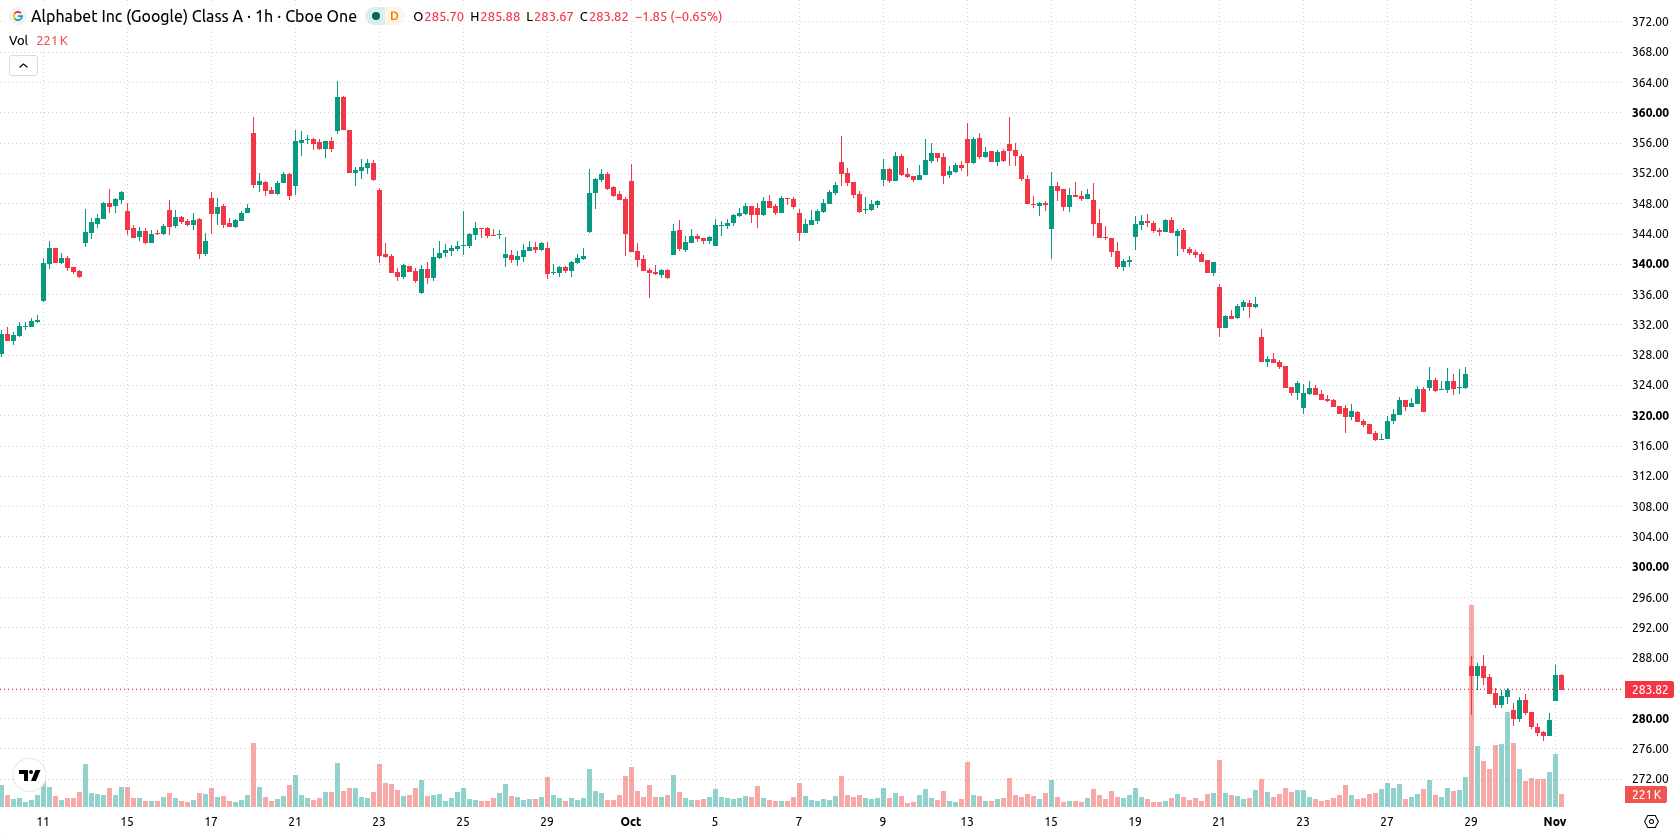
Alphabet (GOOGL) stock is trading at $284.02 after rising 1.37% today. Despite the advance, the price remains below its key moving averages, reflecting ongoing technical pressure in the short and medium term.
 296.33
Highlights
- Shares of Alphabet fell more than 12% after Q3 2026 results missed revenue and EPS estimates, erasing nearly $500 billion in market value.
- Core Google Search contributed less than half of total revenue for the first time, while cloud and subscriptions posted stronger growth and a new securities fraud lawsuit created additional uncertainty.
- Technical signals show sustained bearish momentum with price projected to consolidate between $261.99 and $306.05 over the next four sessions.
Steepest post-IPO selloff as profit margin fears escalate
Alphabet's Q3 2026 earnings release triggered a major market reaction, as the company reported a more than 12% drop in its share price and a loss of nearly $500 billion in market value, marking the steepest single-day decline since its 2004 IPO, according to Yahoo Finance. The decline was driven by slower growth in core search and advertising, missed revenue and EPS estimates, and a sharp swing to negative free cash flow due to heavy investment in AI and data centers—factors that raised immediate concerns about profit margins and capital allocation. At the same time, Alphabet saw Google Search contribute less than half of revenue for the first time, with stronger growth coming from areas like cloud and subscriptions, while a recently filed securities fraud lawsuit added further uncertainty according to Natlawreview and Globenewswire.
Bearish momentum confirmed as moving average resistance aligns with divergent signals
Technically, GOOGL is trading below its MA-20 at $292.8 and MA-50 at $310 on the H1 chart, and well under the MA-200 at $340.65 on the daily timeframe. The Ichimoku Kijun at $301.66 serves as immediate resistance. MACD signals a strong sell, ADX points to ongoing seller dominance, and RSI stands at 38.03, supporting a bearish momentum assessment. Stoch RSI and Bull/Bear Power are both overbought, while CCI and Awesome Oscillator remain neutral—showing divergence among major oscillators.
Downside bias and range trading likely as negative momentum persists
Over the next four trading days, GOOGL is forecast to fluctuate within a $261.99 to $306.05 volatility band relative to current levels. Odds favor further downside, with a 68% probability of a move lower and only a 32% chance of an upward scenario. The baseline expectation is for consolidation within this range as market participants balance negative momentum against episodic buying. A break above the $301.66 resistance could spark additional upside, while a failure to maintain the lower boundary at $261.99 would risk a move toward deeper support.
Earlier, analysts noted that Alphabet shares faced ongoing technical headwinds and heightened regulatory scrutiny following a sharp earnings-driven selloff. The latest trading confirms persistent bearish momentum, with downside risk remaining elevated as markets weigh both disappointing fundamentals and unresolved legal uncertainties; traders should closely watch the $261.99 support level for signs of further breakdown.









-
 Afghanistan
-
 Albania
-
 Algeria
-
 Angola
-
 Argentina
-
 Armenia
-
 Australia
-
 Austria
-
 Azerbaijan
-
 Bahamas
-
 Bahrain
-
 Bangladesh
-
 Belarus
-
 Belgium
-
 Bolivia
-
 Botswana
-
 Brazil
-
 Brunei
-
 Bulgaria
-
 Cambodia
-
 Cameroon
-
 Canada
-
 Chile
-
 China
-
 Colombia
-
 Congo
-
 Costa Rica
-
 Cote d'Ivoire
-
 Croatia
-
 Cuba
-
 Cyprus
-
 Czechia
-
 DR Congo
-
 Denmark
-
 Dominican Republic
-
 Ecuador
-
 Egypt
-
 El Salvador
-
 Estonia
-
 Eswatini
-
 Ethiopia
-
 Finland
-
 France
-
 Georgia
-
 Germany
-
 Ghana
-
 Greece
-
 Haiti
-
 Hong Kong
-
 Hungary
-
 India
-
 Indonesia
-
 Iran, Islamic republic
-
 Iraq
-
 Ireland
-
 Israel
-
 Italy
-
 Jamaica
-
 Japan
-
 Jordan
-
 Kazakhstan
-
 Kenya
-
 Korea
-
 Kuwait
-
 Kyrgyzstan
-
 Laos
-
 Latvia
-
 Lebanon
-
 Lesotho
-
 Libya
-
 Lithuania
-
 Luxembourg
-
 Madagascar
-
 Malaysia
-
 Malta
-
 Mauritius
-
 Mexico
-
 Moldova
-
 Mongolia
-
 Montenegro
-
 Morocco
-
 Mozambique
-
 Myanmar
-
 Namibia
-
 Nepal
-
 Netherlands
-
 New Zealand
-
 Nigeria
-
 North Macedonia
-
 Norway
-
 Oman
-
 Pakistan
-
 Palestine
-
 Panama
-
 Papua New Guinea
-
 Paraguay
-
 Peru
-
 Philippines
-
 Poland
-
 Portugal
-
 Puerto Rico
-
 Qatar
-
 Reunion
-
 Romania
-
 Rwanda
-
 Saudi Arabia
-
 Serbia
-
 Singapore
-
 Slovakia
-
 Slovenia
-
 Somalia
-
 South Africa
-
 Spain
-
 Sri Lanka
-
 Sweden
-
 Switzerland
-
 Syria
-
 Taiwan
-
 Tajikistan
-
 Tanzania
-
 Thailand
-
 Trinidad and Tobago
-
 Tunisia
-
 Turkey
-
 UAE
-
 Uganda
-
 Ukraine
-
 United Kingdom
-
United States
-
 Uruguay
-
 Uzbekistan
-
 Venezuela
-
 Vietnam
-
 Yemen
-
 Zambia
-
 Zimbabwe
- Forex
- Crypto












