

XOM consolidates as oversold conditions and seller dominance weigh on near-term direction

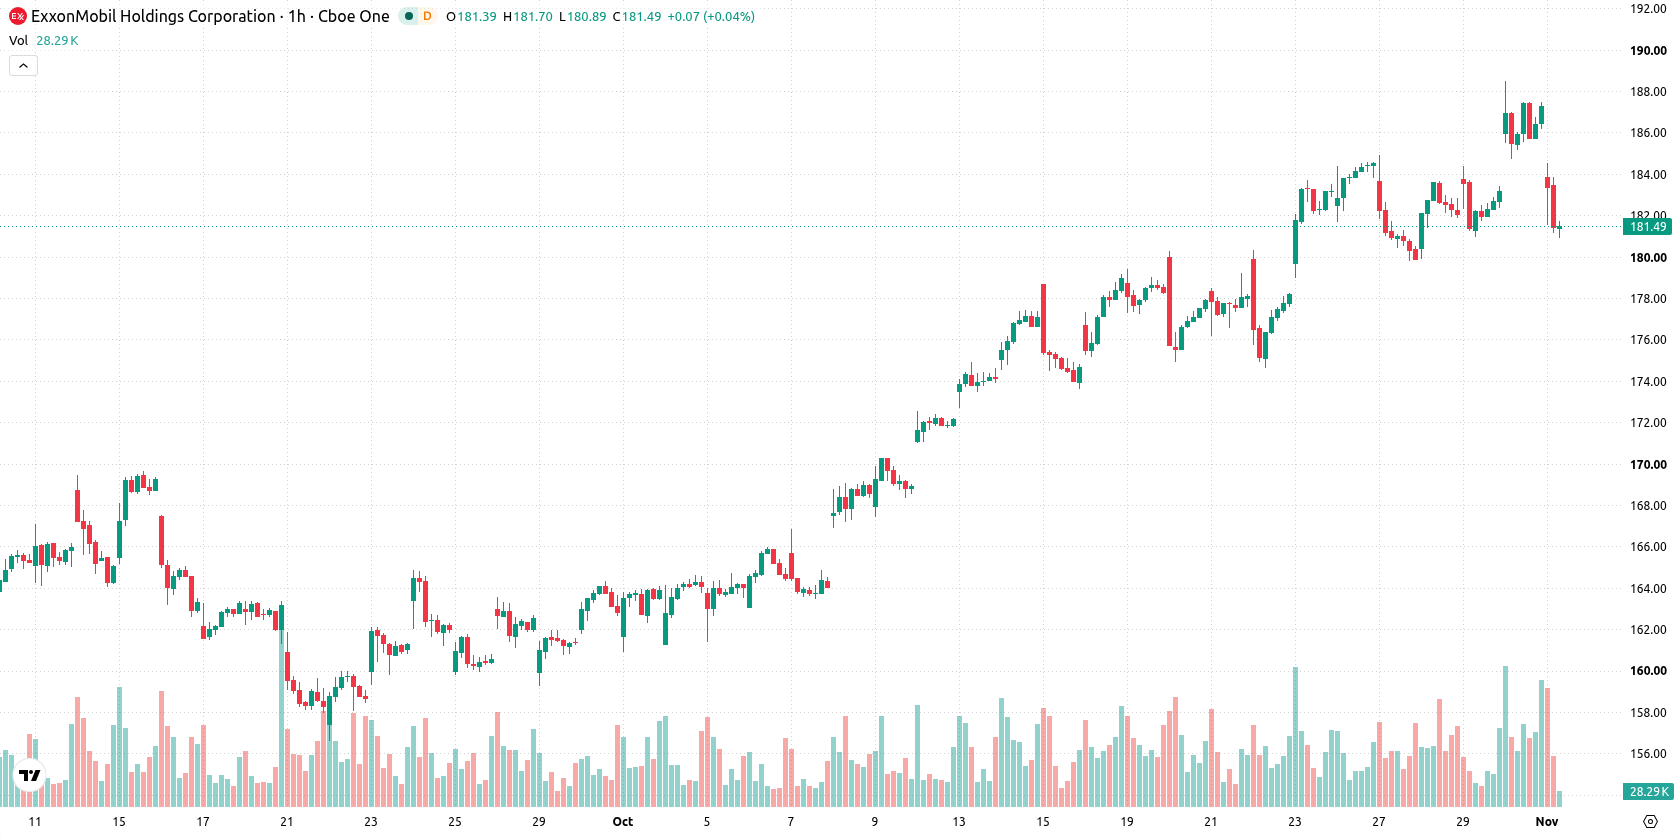
Exxon Mobil (XOM) stock is trading at $181.76, down 2.95% for the session. The share price is positioned below its key moving averages, highlighting prevailing near-term weakness.
 184.59
187.90
Highlights
- ExxonMobil reported third quarter 2026 GAAP earnings of $15.4 billion and $25.7 billion in cash flow from operations.
- The company raised its annual dividend for the 44th year and confirmed $20 billion in annual share buybacks through 2027.
- Shares of ExxonMobil dropped 2.95% for the session and are expected to trade between $178.14 and $185.38 with mixed technical signals supporting sideways movement.
Ongoing capital returns as profits and buybacks counter selling pressure
ExxonMobil reported GAAP earnings of $15.4 billion for the third quarter of 2026, as disclosed by Fool, delivering tangible profit results that shape market valuation and sentiment. The company announced $25.7 billion in cash flow from operations for the same period, providing resources to fund ongoing dividends and capital investments. ExxonMobil extended its track record of shareholder returns by raising its annual dividend per share for the 44th consecutive year and declaring a Q4 2026 dividend of $1.07 per share, according to Coffeeandearnings Substack. Furthermore, the commitment to $20 billion in annual share buybacks through 2027 supports its focus on capital returns, though price action has remained under broader selling pressure.
Mixed momentum as price holds below resistance and averages
On the technical front, XOM trades below the MA-20 at $183.88 and MA-50 at $182.42 on the 1-hour chart, while remaining comfortably above the MA-200 at $154.6 on the daily timeframe. Immediate resistance is seen at the Ichimoku Kijun level of $184.14. Momentum signals are mixed: MACD points to strong upside, ADX reflects only a mild buy, and RSI sits at 44.5 with a sell bias. Stoch RSI and Bull/Bear Power both indicate oversold, seller-dominated conditions, while CCI and Awesome Oscillator are neutral, highlighting technical indecision.
Balanced outlook as XOM faces range-bound trading risk
In the next 2–3 sessions, XOM is likely to consolidate within a typical volatility range between $178.14 and $185.38. The probability of an upward versus downward move is balanced at 50%, indicating no clear directional bias. A bullish scenario would require a break and close above the $184.14 resistance, while a drop below $178.14 would shift momentum in favor of bears.
Previously it was reported that higher fuel costs, influenced by disruptions in global oil shipping, have heightened the financial and political importance of energy prices particularly among Texas households and oil companies like Exxon Mobil. In light of ExxonMobil’s latest earnings performance and continued capital returns amid technical indecision, traders should monitor potential volatility around the $178.14–$185.38 range, as a confirmed break of these boundaries could signal the next directional move.






Latest Exxon News





-
 Afghanistan
-
 Albania
-
 Algeria
-
 Angola
-
 Argentina
-
 Armenia
-
 Australia
-
 Austria
-
 Azerbaijan
-
 Bahamas
-
 Bahrain
-
 Bangladesh
-
 Belarus
-
 Belgium
-
 Bolivia
-
 Botswana
-
 Brazil
-
 Brunei
-
 Bulgaria
-
 Cambodia
-
 Cameroon
-
 Canada
-
 Chile
-
 China
-
 Colombia
-
 Congo
-
 Costa Rica
-
 Cote d'Ivoire
-
 Croatia
-
 Cuba
-
 Cyprus
-
 Czechia
-
 DR Congo
-
 Denmark
-
 Dominican Republic
-
 Ecuador
-
 Egypt
-
 El Salvador
-
 Estonia
-
 Eswatini
-
 Ethiopia
-
 Finland
-
 France
-
 Georgia
-
 Germany
-
 Ghana
-
 Greece
-
 Haiti
-
 Hong Kong
-
 Hungary
-
 India
-
 Indonesia
-
 Iran, Islamic republic
-
 Iraq
-
 Ireland
-
 Israel
-
 Italy
-
 Jamaica
-
 Japan
-
 Jordan
-
 Kazakhstan
-
 Kenya
-
 Korea
-
 Kuwait
-
 Kyrgyzstan
-
 Laos
-
 Latvia
-
 Lebanon
-
 Lesotho
-
 Libya
-
 Lithuania
-
 Luxembourg
-
 Madagascar
-
 Malaysia
-
 Malta
-
 Mauritius
-
 Mexico
-
 Moldova
-
 Mongolia
-
 Montenegro
-
 Morocco
-
 Mozambique
-
 Myanmar
-
 Namibia
-
 Nepal
-
 Netherlands
-
 New Zealand
-
 Nigeria
-
 North Macedonia
-
 Norway
-
 Oman
-
 Pakistan
-
 Palestine
-
 Panama
-
 Papua New Guinea
-
 Paraguay
-
 Peru
-
 Philippines
-
 Poland
-
 Portugal
-
 Puerto Rico
-
 Qatar
-
 Reunion
-
 Romania
-
 Rwanda
-
 Saudi Arabia
-
 Serbia
-
 Singapore
-
 Slovakia
-
 Slovenia
-
 Somalia
-
 South Africa
-
 Spain
-
 Sri Lanka
-
 Sweden
-
 Switzerland
-
 Syria
-
 Taiwan
-
 Tajikistan
-
 Tanzania
-
 Thailand
-
 Trinidad and Tobago
-
 Tunisia
-
 Turkey
-
 UAE
-
 Uganda
-
 Ukraine
-
 United Kingdom
-
United States
-
 Uruguay
-
 Uzbekistan
-
 Venezuela
-
 Vietnam
-
 Yemen
-
 Zambia
-
 Zimbabwe
- Forex
- Crypto












